

System and process logging are just two of the most pivotal advantages of systemd. When logs are dispersed throughout the system, span multiple applications, and are handled by different processes and daemons, they can be challenging to interpret. Systemd provides a centralized solution for managing all of the kernel and userland process logs in a compilation medium known as a journal. You can learn more about systemd in our tutorial on how to manage systemd services and units with systemctl. All of the messages generated by services, initrd, kernels, etc. in a journal are handled by the journal daemon. The purpose of this guide is to illustrate how to access and manipulate the journal’s data by using journalctl.
Basic Premise
Regardless of where a message might originate, one of the systemd’s primary messages is to permit their management to be centralized. As many of the boot processes and much of the service management are taken care of by the systemd process, the way the logs are compiled and accessed should be standardized. Collecting data from any available sources into one all-encompassing tool, journald stores them in a binary format. This allows the data to be readily available for dynamic and simple manipulation.
This approach has several key advantages. By having a central place to collect all of the data, administrators can filter down to and display only the date that they need. For instance, one can view boot data from three system boots ago. It could also mean the sequential logging of entries from related services and more effectively track down a communication issue between them.
Thanks to the binary storage, data can be displayed in a variety of output formats depending on the user’s needs at the time. For example, a daily log may be viewed in a standard syslog format. But if you need to trend service interruptions in the form of a graph, the entry can be output as a JSON object, making it workable with a graphing service. When you need to change formats depending on situational demands, there is no conversion needed since the data is binary, and not written to disk in plain text.
Depending on one’s needs, you can implement the systemd journal with an existing syslog or it can replace the functionality. Systemd can even complement existing logging mechanisms. For example, multiple services on a single system can have their compiled data interwoven on a single system with the systemd journal.
Setting The System Time
Systemd will, by default, display results in local time, a benefit of binary journal logging in how log records can be viewed. Alternatively, they can be viewed in UTC. Thus, it is important to make certain that the timezone is set up correctly before getting started with the journal logging. To do this, systemd is equipped with a tool called timedatectl. We start by seeing what time zones are available to use by displaying a list with list-timezones options:
|
1 |
timedatectl list-timezones |
After finding the timezone match for your server’s location, the timezone can be set by using the set-timezone option:
|
1 |
sudo timedatectl set-timezone zone |
To test and verify that the timezone is now displaying appropriately you can sue the timedatectl command either on its own or with adding ‘status:’
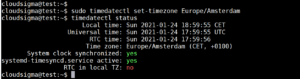
The first line depicts the local time. This line should contain the correct time for your local region.
General Log Viewing
The journalctl command will allow you to view the logs that the journald daemon has collected. When you use journalctl, every journal entry from the system will be displayed within the screen page, with the oldest entries listed towards the top. The full list of data will be, however, tens of thousands of lines long.
|
1 |
journalctl |
Those who have used standard syslog logging will find the format familiar, but it’s important to keep in mind that this compilation of data is included from many sources, unlike the syslog method. The logs will include the early boot process, the initrd, and the kernel, as well as application standard errors.
Now that the local time is set, all of the entries will begin with timestamps placed in local time, and is available for every log currently stored on the system, with all of the logic being displayed by using this new information. You are not confined to local time, however. Using the –utc flag, you can display timestamps in UTC as well:
|
1 |
journalctl --utc |
Journal Filtering by Time
Having so much data available is fantastic, but combing through it and being able to absorb it, not to mention to process it mentally can be a daunting task. With this in mind, we reach the most important part of the journalctl function: filtering.
Logs Display From The Current Boot
If you are looking for the data in the journal from the latest reboot, you could use the journalctl function with a -b flag. This will display all of the pertinent log information from your system’s most recent reboot. This command will permit you to find and manage the information most pertinent to the current work environment:
|
1 |
journalctl -b |
If the viewer chooses not to evaluate each individual entry, journactl will show more than a day of boots that will display in journalctl with convenient ‘Reboot’ separators. This helps to logically separate information from different boot sessions for review:
|
1 2 3 |
. . . -- Reboot -- . . . |
Past Boot Information
While displaying current boot information tends to be the most useful, there are situations where past boot information will prove helpful. Journal saves information for multiple prior boots, so journalctl can easily display the information for any time period.
Certain distributions disable the saving of previous boot information, while others have it enabled by default. Enabling the persistent boot information can be accomplished by creating a directory for storage of the journal by typing the following:
|
1 |
sudo mkdir -p /var/log/journal |
Alternatively, you can edit the journal configuration file in the following manner:
|
1 |
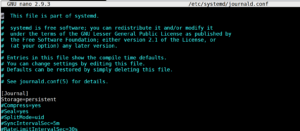
sudo nano /etc/systemd/journald.conf |
Setting the Storage= option to “persistent” under the [Journal] section will enable persistent logging:
Once this is enabled, journalctl makes available certain commands that help you designate these boots as units of division. To view the boots that have been recorded in journald, you can use the –list-boots option via journalctl:
|
1 |
journalctl --list-boots |
![]()
As illustrated, each boot will be listed on its own line with the first column reflecting the prior boots in order from oldest to most recent. If a more absolute reference is needed, the second column contains the boot identification. After that, there are two time specifications listed. Information from either the first or second column can be used to display the journal information from the specific boot. For example, you can use the -b flag with the relative boot pointer -1 to view information to the second to the most recent reboot:
|
1 |
journalctl -b -1 |
Similarly, the boot id from the second column can also be used in this fashion:
|
1 |
journalctl -b 54342de612174d269b66f1d5eb098abb |
Time Windows
Viewing boots by id is one option, but it is often more useful to be able to reference prior boots by a window of time in the past that may not necessarily align with specific boots. For example, this is relevant in a situation when one is working with long-running servers that are not rebooted frequently. The filtering of time limits can be done with arbitrary time limits. This will display only information about the reboots that fall within a particular time window. The parameters of this window are designated with the –since and –until options. There are several formats available for time options. The absolute time value format is as follows:
|
1 |
YYYY-MM-DD HH:MM:SS |
So, if you want to see all of the boots since January 10th, 2015 @ 5:15 PM, type the following command:
|
1 |
journalctl --since "2015-01-10 17:15:00" |
If any of the components are omitted, there are built-in defaults. Furthermore, if a date is left out, the current date defaults. If the time component is absent, then midnight is the default (00:00:00). If you leave the seconds off the time component, they will default to the initial point of that minute (00):
|
1 |
journalctl --since "2015-01-10" --until "2015-01-11 03:00" |
The journal can understand time-related shortcuts like “today”, “tomorrow”, “yesterday,” and “now.” Words like ago, in conjunction with prepended qualifiers “-” and “+” can be used to construct a sentence type command:
|
1 |
journalctl --since yesterday |
If you were notified of interrupted service which began at 9:00 and want to check the journal logs to up to an hour ago, you can do so with the following:
|
1 |
journalctl --since 09:00 --until "1 hour ago" |
As evident, defining a flexible time window for viewing desired entries is very simple.
Filter By Message Interest
Aside from filtering the journal by time constraints, the data can also be filtered based on the service component of interest. Systemd provides several methods to do this.
By Unit
Arguably the most useful filtering parameter is by the unit of interest. To filter by unit, the -u option can be leveraged. For example, if you wish to see all of the logs pertaining to the Nginx unit, type the following command:
|
1 |
journalctl -u nginx.service |
Realistically, you would want to pair this with a time filter in order to display the interesting lines. If you want to check the above service and how it has performed today, you can do the following:
|
1 |
journalctl -u nginx.service --since today |
This is especially useful when utilizing the journal’s ability to compile records from multiple units, especially collaborative ones. If the Nginx process is connected to a PHP-FPN unit for dynamic content processing, the entries can be merged in chronological order by specifying both units:
|
1 |
journalctl -u nginx.service -u php-fpm.service --since today |
This can greatly assist in noting program interaction and make debugging systems instead of individual processes easier.
By Group ID, Process, or User
Many services kick off a multitude of sub-processes (child processes) to perform specific work. If the ID of a particular process is available, it can also be filtered by specifying the _PID field. If the interesting PID is 8088, the following can be done:
|
1 |
journalctl _PID=8088 |
You may also want to see entries logged from a particular group or a particular user. This can be accomplished by using the _GID and _UID filters. If a web server runs under the user www-data, the following can find the necessary ID:
|
1 |
id -u www-data |
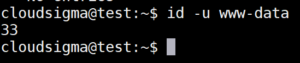
Using that ID, you can then view the qualified journal results:
|
1 |
journalctl _UID=33 --since today |
Systemd makes many fields available for filtering purposes. Some fields are applied by journald based on information gathered from the system at log time, while others are passed in from the process currently being logged.
A pre-qualifier of _PID indicates that the information has been gathered from the system at the time of logging. The journal records and indexes the PID automatically during the logging process to make filtering ability available later. To find out about the available journal fields, you can type:
|
1 |
man systemd.journal-fields |
We will discuss some of these later in this guide, but for now, we will touch upon some other useful options pertaining to these fields. If you want to see all of the available values for a particular journal field, you can use the -F option. If you wish to see what systemd journal has for group IDs, the following can be done:
|
1 |
journalctl -F _GID |
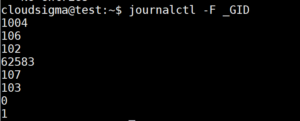
This can assist in constructing filters by providing a full list of values that the journal group ID field has stored.
By Component Path
Filtering can also be performed by providing a path location. If the path is to an executable, entries in journactl will be displayed if they involve that executable. If the interesting executable is ‘bash’, you can type:
|
1 |
journalctl /bin/bash |
While sometimes it is not possible to do, if the executable’s unit is available it can generate a clear and more informational method for filtering.
Display Kernel Messages
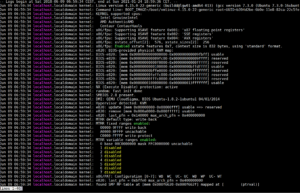
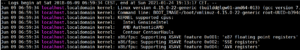
The kernel messages, typically found in dmseg output, can also be retrieved from the journal. In order to have only these messages displayed we utilize either -k or -dmesg flags as part of our command:
|
1 |
journalctl -k |
Messages from the current boot will display by default, but prior boots can be specified as the previously mentioned selection flag utilization. If you are looking for messages from five boots ago, typing this will get you the necessary results:
|
1 |
journalctl -k -b 5 |
By Priority
System administrators often prefer filtering by priority. Low priority logs, while often useful to view, can be confusing and contain many distractions, making them less digestible during analysis. Using the -p option in journalctl will display only messages of a specified priority, filtering any other priorities out. If you wish to show entries from the error level or above, enter the following:
|
1 |
journalctl -p err -b |
That command will return all messages denoted as errors, alert, emergency, or critical with the journal using the standard syslog messaging levels. Priority levels are defined according to a numeric value, ranked from highest to lowest:
- 0: emerg
- 1: alert
- 2: crit
- 3: err
- 4: warning
- 5: notice
- 6: info
- 7: debug
Any of the above are interchangeably usable with the -p option. Selecting any of the priorities as outlined above will filter all of the priorities at that level and above.
Modifying The Display In Journal
Besides using filtering for entry selection, we have other methods of modifying the output, tailoring journactl’s display to fit our needs.
Truncate/Expand Output
We can adjust the view of our output by adjusting whether journalctl shrinks or expands the data. Journalctl’s default is to show the full entry, trailing longer entries off to the right of the screen. You can view the entries in their entirety by scrolling via the right arrow key. A user may wish to truncate the output instead, with an ellipsis denoted on the lines that will otherwise run off the screen. For this, a –no-full option can be used:
|
1 |
journalctl --no-full |
Alternatively, you can also permit the display to allow for everything regardless of length or inclusion of unprintable characters by using the -a flag:
|
1 |
journalctl -a |
Output To Standard Out
Journalctl displays the output to a pager by default, but if you wish to manipulate the data with text editing tools, you likely need the output to be generated to a standard output option. You can achieve this with the –no-pager option:
|
1 |
journalctl --no-pager |
Depending on the user’s needs this can be redirected to a file on disk or a processing utility.
Output Formats
Data is always easier to parse when presented in a more consumable format. The journal provides multiple options for display using the -o qualifier followed by a specifically denoted format.
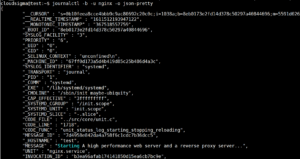
If you wish to output the journal entries to a JSON format, you can do so in the following manner:
|
1 |
journalctl -b -u nginx -o json |
![]()
This strategy is particularly useful when parsing utilities. The json-pretty format can be better at displaying the data structures before you pass it to the JSON consumer:
|
1 |
journalctl -b -u nginx -o json-pretty |
There are several formats that you can utilize for display:
- cat: Displays only the message field itself.
- export: A binary format suitable for transferring or backing up.
- json: Standard JSON with one entry per line.
- json-pretty: JSON formatted for better human-readability
- json-sse: JSON formatted output wrapped to make add server-sent event compatible
- short: The default syslog style output
- short-iso: The default format augmented to show ISO 8601 wallclock timestamps.
- short-monotonic: The default format with monotonic timestamps.
- short-precise: The default format with microsecond precision
- verbose: Shows every journal field available for the entry, including those usually hidden internally.
The above options permit the journal to display in your preferred format.
Active Process Monitoring
The journal allows access to monitoring active or recent activity features without having to involve another tool. You cando this with the journalctl command with a ‘tail’ function.
-
Displaying Recent Logs
Displaying the -n option (which works just like the tail-n command), will permit the display of a certain amount of records:
|
1 |
journalctl -n |
The number of entries that you would like to have displayed can be specified with a particular number after the -n qualifier:
|
1 |
journalctl -n 20 |
-
Following The Logs
You can also follow the logs actively as they are being written to the system with the -f flag. This also works in the same manner as the tail -f command:
|
1 |
journalctl -f |
Journal Maintenance
Logs do take up space. This is worth exploring, potentially for clearing out some of the older logs to free up space.
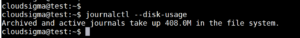
Finding Current Disk Usage
The –disk-usage flag can help identify how much space logging is currently occupying on disk:
|
1 |
journalctl --disk-usage |
Deleting Old Log
With systemd version 218 (and subsequent versions) you can shrink the journal in two different ways. One is the –vacuum-size option. This can shrink the journal by indicating its size. In other words, older entries will be purged from the log until the occupied space is at the requested parameter:
|
1 |
sudo journalctl --vacuum-size=1G |
The –vacuum-time option can shrink the space occupation of the journal by indicating a cut-off time, any entries beyond which will be deleted, while those created after the specified time will be retained. If you wish to keep entries from just the last calendar year, you can use:
|
1 |
sudo journalctl --vacuum-time=1years |
Limit Journal Expansion
You can also limit the amount of space the journal will take up. This is accomplished by editing the /etc/systemd.journald.conf file. The journal growth can be limited by using any of the following methods:
- SystemMaxUse=: Denotes the maximum disk space the journal is permitted to use in persistent storage.
- SystemKeepFree=: Denotes how much space should be left free when the journal entities are added in persistent storage.
- SystemMaxFileSize=: Specifies how large the journal files are permitted to grow until rotation in persistent storage.
- RuntimeMaxUse=: Specifies how much disk space is allowed to be used in volatile storage (within the /run filesystem).
- RuntimeKeepFree=: When writing data to volatile storage, this function denotes the amount of space that must be dedicated to other uses (within the /run filesystem).
- RuntimeMaxFileSize=: Denotes how much space an individual log journal can take up on volatile storage (within the /run filesystem) before it needs to be prorated.
These options can all help control storage consumption by the journal. An important fact to note is that the SystemMaxFileSize and the RuntimeMaxFileSize option will be targeting archived files to reach the stated limits. This is an important fact to keep in mind when interpreting file counts post-vacuuming operations.
Conclusion
It is evident that the systemd journal is an incredibly useful tool to leverage, with the majority of its benefits stemming from the logs’ centralized nature and the extensive volume of recorded metadata. The extensive features of the journal can be taken advantage of by the journalctl command’s utilization, promoting an easier method to perform relational debugging of application components, as well as extensive system analysis.
Happy Computing!
- Removing Spaces in Python - March 24, 2023
- Is Kubernetes Right for Me? Choosing the Best Deployment Platform for your Business - March 10, 2023
- Cloud Provider of tomorrow - March 6, 2023
- SOLID: The First 5 Principles of Object-Oriented Design? - March 3, 2023
- Setting Up CSS and HTML for Your Website: A Tutorial - October 28, 2022