

In the generation of cloud computing, virtual machines (VMs) have become very common, while the usage of physical machines has started to gradually decrease. In this post, we will introduce the tools, ‘vnStat’ and ‘iftop,’ which we can use to monitor data consumption in a VM.
First, I am creating a machine with the following resources:
20 GHz CPU
16 GB RAM
20 GB SSD
I am mounting the disk with Ubuntu 18.04 image that is available in CloudSigma’s library.
Ubuntu 18.04 : Pre-installed 64bit with VirtIO drivers, superuser, Python 2.7.15, Pip 18.0, OpenSSL 1.1.0i, Cloud-init and latest updates until 2018-09-30.
Next, I am updating all existing repos and packages on the machine.
|
1 2 |
sudo apt update sudo apt upgrade |
Now that our system is up- to- date, I will move towards our tools, ‘vnStat’ and ‘iftop’.
VNSTAT
According to humdi, vnStat is a console-based network traffic monitor for Linux and BSD that keeps a log of network traffic for the selected interface(s). It uses the network interface statistics provided by the kernel as information source. This means that vnStat won’t actually be sniffing any traffic and also ensures light use of system resources.
Some of the features of vnStat are:
- Even if the system restarts, the data still persists.
- It can monitor multiple interfaces at the same time.
- There are several output options, example, day wise, week wise, etc.
- Data Retention policies can be configured by the user.
- Months can be configured according to the billing cycle.
- The tool itself is very light and resource usage is minimal.
- CPU usage will be the same regardless of the traffic.
Installation
Use the following command to install vnStat:
|
1 |
sudo apt install vnstat |
It should automatically detect the network interface. In case it doesn’t, I can check the interface with the command:
|
1 |
ip addr |
In my case I can see two interfaces:
|
1 2 3 4 5 6 7 8 9 10 11 12 |
1: lo: <LOOPBACK,UP,LOWER_UP> mtu 65536 qdisc noqueue state UNKNOWN group default qlen 1000 link/loopback 00:00:00:00:00:00 brd 00:00:00:00:00:00 inet 127.0.0.1/8 scope host lo valid_lft forever preferred_lft forever inet6 ::1/128 scope host valid_lft forever preferred_lft forever 2: ens3: <BROADCAST,MULTICAST,UP,LOWER_UP> mtu 1500 qdisc fq_codel state UP group default qlen 1000 link/ether 22:af:d1:32:d2:0b brd ff:ff:ff:ff:ff:ff inet XXX.XXX.XX.XXX/24 brd XXX.XXX.XX.XXX scope global dynamic ens3 valid_lft 1853sec preferred_lft 1853sec inet6 fe80::20af:d1ff:fe32:d20b/64 scope link valid_lft forever preferred_lft forever |
I can ignore the loopback interface. The interface that I want to monitor is ‘ens3’. I can update this in vnStat by using the command:
|
1 |
sudo vnstat -u -i ens3 |
Usage Guide
The usage guide can be seen using the command: vnStat –help
Usage will be described like this:
|
1 2 3 4 5 6 7 8 9 10 11 12 13 14 15 16 17 18 |
vnStat 1.18 by Teemu Toivola <tst at iki dot fi> -q, --query query database -h, --hours show hours -d, --days show days -m, --months show months -w, --weeks show weeks -t, --top10 show top 10 days -s, --short use short output -u, --update update database -i, --iface select interface (default: ens3) -?, --help short help -v, --version show version -tr, --traffic calculate traffic -ru, --rateunit swap configured rate unit -l, --live show transfer rate in real time See also "--longhelp" for complete options list and "man vnstat". |
With the help of these commands, we can get the metrics of data usage.
For monitoring it easily and intuitively, we can install vnStat dashboard. Following are the steps to install the dashboard:
Install the following required dependencies:
|
1 |
sudo apt install apache2 php wget unzip -y |
After installation of the required dependencies, we will fetch the dashboard from github repository, unzip it and place it in our web server directory.
|
1 2 3 |
wget https://github.com/alexandermarston/vnstat-dashboard/archive/master.zip unzip master.zip sudo mv vnstat-dashboard-master/ /var/www/html/vnstat/ |
Next, we need to edit the configuration.
|
1 |
sudo vi /var/www/html/vnstat/config.php |
The following lines would need a change. I am marking the required changes in bold.
|
1 2 3 4 5 6 7 |
$use_predefined_interfaces = <strong>true</strong>; if ($use_predefined_interfaces == <strong>true</strong>) { $interface_list = <strong>["ens3"]</strong>; $interface_name<strong>['ens3']</strong> = "Test Interface"; } |
I can name the interface in order to make it easier to monitor. One can have multiple interfaces to monitor. We can add those here.
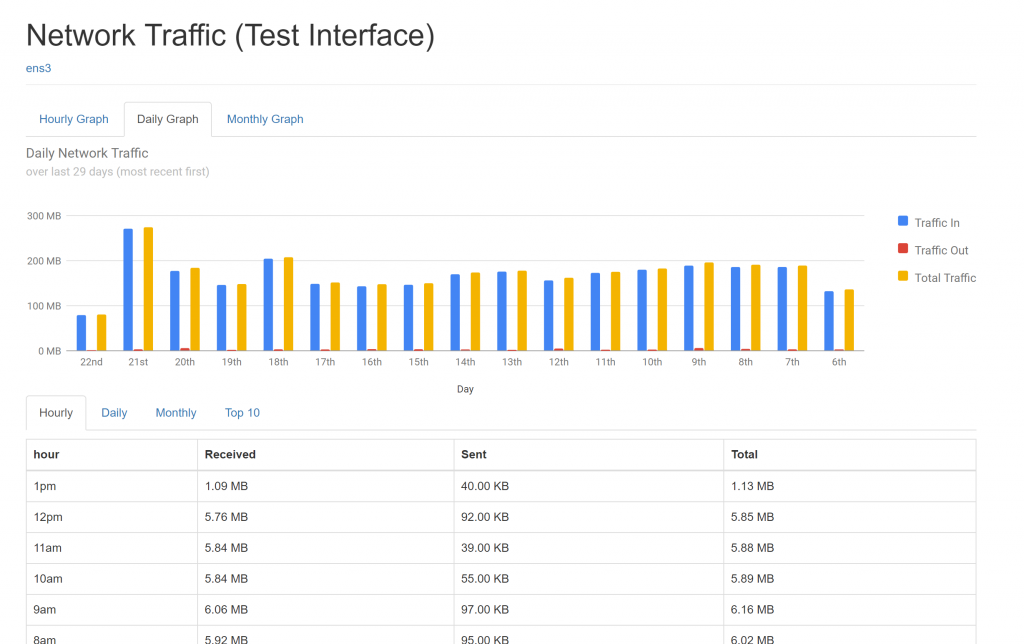
After you have made the changes, open <<IP-ADDRESS>>/vnstat
I am able to see the data in an elegant way now.
IFTOP
iftop listens to network traffic on a named interface, or on the first interface it can find which looks like an external interface if none is specified. It displays a table of current bandwidth usage by pairs of hosts. We must run iftop with sufficient permissions to monitor all network traffic on the interface.
Installation
We can install Iftop using the following command:
|
1 |
sudo apt install iftop |
Usage Guide
The usage guide can be seen using the command: iftop -h
Usage will be described like this:
|
1 2 3 4 5 6 7 8 9 10 11 12 13 14 15 16 17 18 19 20 21 22 23 24 25 26 27 28 29 30 31 32 33 34 35 36 |
iftop: display bandwidth usage on an interface by host Synopsis: iftop -h | [-npblNBP] [-i interface] [-f filter code] [-F net/mask] [-G net6/mask6] -h display this message -n don't do hostname lookups -N don't convert port numbers to services -p run in promiscuous mode (show traffic between other hosts on the same network segment) -b don't display a bar graph of traffic -B Display bandwidth in bytes -i interface listen on named interface -f filter code use filter code to select packets to count (default: none, but only IP packets are counted) -F net/mask show traffic flows in/out of IPv4 network -G net6/mask6 show traffic flows in/out of IPv6 network -l display and count link-local IPv6 traffic (default: off) -P show ports as well as hosts -m limit sets the upper limit for the bandwidth scale -c config file specifies an alternative configuration file -t use text interface without ncurses Sorting orders: -o 2s Sort by first column (2s traffic average) -o 10s Sort by second column (10s traffic average) [default] -o 40s Sort by third column (40s traffic average) -o source Sort by source address -o destination Sort by destination address The following options are only available in combination with -t -s num print one single text output afer num seconds, then quit -L num number of lines to print iftop, version 1.0pre4 copyright (c) 2002 Paul Warren <pdw@ex-parrot.com> and contributors |
It needs root permission to work. I am simply using sudo since my user cloudsigma is a sudoer user. I can also use the command ‘sudo su’ and then run all the commands as root user.
The following command would give me a display of all the connections on the interface ‘ens3’ and the data transactions:
|
1 2 |
sudo su iftop |
A simpler way if the requirement is to capture the data traffic for a particular set of time:
|
1 |
iftop -t -s 30 |
The above command would summarise the data traffic transactions for the coming 30 seconds and after completion of the time, would give a table listing all the data usage and transfer rates.
Though iftop gives live transfer rates, it doesn’t store the data or have a dashboard for us to intuitively visualise and see the patterns. Hence, if we want to see live data transfer rates, we recommend iftop. For data traffic monitoring over a longer period, we recommend vnStat.
We hope you can use this guide to your advantage and apply the basics of how to use vnStat and iftop to monitor data consumption within a VM.
- Removing Spaces in Python - March 24, 2023
- Is Kubernetes Right for Me? Choosing the Best Deployment Platform for your Business - March 10, 2023
- Cloud Provider of tomorrow - March 6, 2023
- SOLID: The First 5 Principles of Object-Oriented Design? - March 3, 2023
- Setting Up CSS and HTML for Your Website: A Tutorial - October 28, 2022