

The Elastic Stack (previously known as the ELK Stack) is a powerful solution for centralized logging. It’s a collection of open-source software developed by Elastic. It allows admins to search, analyze, and visualize logs generated from any source in any format. It’s a form of practice known as centralized logging. Centralized logging can be very handy when trying to pinpoint problems with servers and applications as it allows searching through all the logs from a single place. It can also help identify issues across multiple servers by correlating the logs at a specific time.
In this guide, check out how to install Elastic Stack on Ubuntu 18.04. First, follow our tutorial to easily install your Ubuntu server on CloudSigma.
The Elastic Stack on Ubuntu
The Elastic Stack consists of the following components:
- Elasticsearch: A distributed RESTful search engine. It stores all the data collected.
- Logstash: The data processing piece of the Elastic Stack. It sends incoming data to Elasticsearch.
- Kibana: A web interface, offering search, and log visualization features.
- Beats: A lightweight, single-purpose data transmitter. It can send data from numerous machines to Logstash or Elasticsearch.
You will need to install manually each component of the stack.
Prerequisites
Before proceeding with the installation of the Elastic Stack, several system requirements must be met:
- Hardware requirements:
- CPU: 2 CPUs (accessible from a non-root sudo user)
- RAM: 4GB
- OpenJDK 11 (the latest Java LTS release). To install this, take a look at our tutorial on how to set up Java on Ubuntu 18.04.
- Nginx with proper configurations. You can follow our guide to install Nginx on Ubuntu 18.04 to set it up.
Note that the amount of storage depends on the number of logs to be collected and stored. Besides, the Elastic Stack also deals with valuable information about the server. To keep the data transmission secure, we strongly recommend configuring a TLS/SSL certificate. Follow this tutorial to acquire a free SSL certificate on your Nginx server.
In addition to an encrypted server, the following steps are also going to be necessary:
- An FQDN (fully qualified domain name). In this guide, it will be <domain>.
- Both of the DNS records of the following domains direct to the server.
- A record with <domain> pointing to the server’s public IP.
- A record with www.<domain> pointing to the server’s public IP.
Installing the Elastic Stack
-
Configuring Elastic repo
The components of the Elastic Stack aren’t available directly from the official Ubuntu repo. Thankfully, Ubuntu allows 3rd-party repos to install packages. For our purpose, we’ll be adding the Elastic package repo. The repo offers all the latest package updates of all Elastic packages. All the Elastic packages are signed with the Elasticsearch signing key to prevent package spoofing. First, add the key to the Ubuntu keyring:
|
1 |
curl -fsSL https://artifacts.elastic.co/GPG-KEY-elasticsearch | sudo apt-key add - |
Then, add the Elastic source list under the “sources.list.d” directory. It’s the dedicated directory that APT uses for searching for new sources:
|
1 |
echo "deb https://artifacts.elastic.co/packages/7.x/apt stable main" | sudo tee -a /etc/apt/sources.list.d/elastic-7.x.list |
Finally, update the APT cache:
|
1 |
sudo apt update |
According to the official documentation, it’s recommended to install each of the components in the order demonstrated in this guide. This ensures that the components each product depends on are in the right place.
-
Installing and configuring Elasticsearch
Once the Elastic repo is configured, APT is ready to download and install all the Elastic packages. Run the following command to install Elasticsearch:
|
1 |
sudo apt install elasticsearch |
Now you can configure the Elasticsearch. The file “elasticsearch.yml” provides configuration options about clusters, nodes, paths, networks, memory, gateway, and others. Most of them come pre-configured in the file. Next, open the Elasticsearch configuration file with a text editor of your choice:
|
1 |
sudo vim /etc/elasticsearch/elasticsearch.yml |
Elasticsearch listens on port 9200 from anywhere. We recommend to restrict outside access to Elasticsearch to prevent outsiders from reading the data or shutting down the Elasticsearch clusters using its REST API. To restrict access to Elasticsearch and harden its security, uncomment the following line and replace its value:
|
1 |
network.host: localhost |
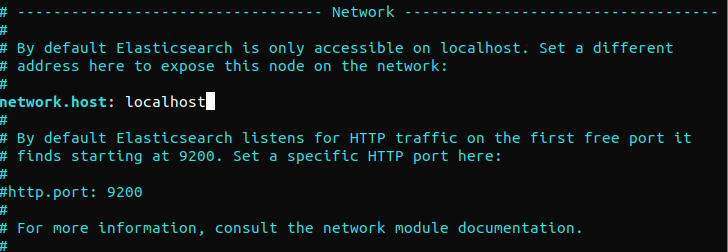
If Elasticsearch is to listen to a specific IP address, replace “localhost” with the target IP address. This is the minimum configuration requirement before running Elasticsearch. Save and close the configuration file. Next, start the Elasticsearch service. It may take a few moments to start Elasticsearch:
|
1 |
sudo systemctl start elasticsearch |
After that, you need to ensure that Elasticsearch starts each time the server boots:
|
1 |
sudo systemctl enable elasticsearch |
The following command will verify whether the Elasticsearch service is running. All it requires is sending an HTTP request:
|
1 |
curl -X GET "localhost:9200" |
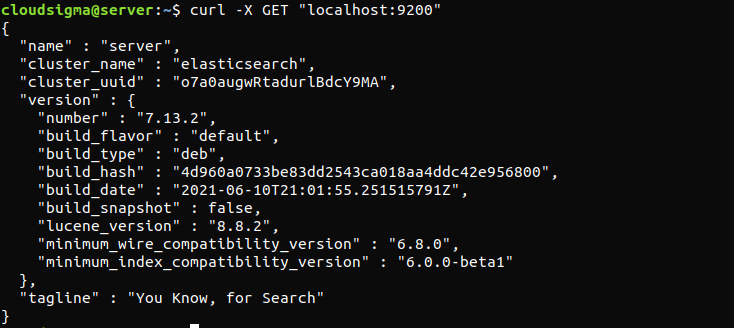
The response will look something like this. It will be a response showing some basic info about the local node.
Installing and Configuring the Kibana Dashboard
Kibana is directly available from the Elastic repo. Note that you should only install Kibana after you have already installed Elasticsearch. Assuming the repo is already available, APT can directly grab and install Kibana:
|
1 |
sudo apt install kibana |
Once installed, enable and start the Kibana service:
|
1 2 |
sudo systemctl enable kibana sudo systemctl start kibana |
By default, Kibana is configured to only listen to “localhost.” For external access, it requires the configuration of a reverse proxy. Here, Nginx will be the reverse proxy. Use the openssl command for creating an admin Kibana user. It’ll be the user account for accessing the Kibana web interface. Here, the example username will be “kibana_admin.” To ensure better security, we recommend using a non-standard username. The following command will create an admin user for Kibana. The username and password will be generated and stored in the “htpasswd.users” file. Nginx will have to be configured to use the username and password:
|
1 |
echo "kibana_admin:`openssl passwd -apr1`" | sudo tee -a /etc/nginx/htpasswd.users |
Enter and confirm a password at the prompt. This password is going to be important for accessing the Kibana interface. After that, you need to create an Nginx server block file. For demonstration, it will be example.com. It can also be any other descriptive name. If there are FQDN and DNS records configured for the server, the file name can also be after the FQDNz:
|
1 |
sudo vim /etc/nginx/sites-available/example.com |
If there’s any pre-existing content, remove the contents, and replace it with the following lines of code:
|
1 2 3 4 5 6 7 8 9 10 11 12 13 14 15 16 17 18 |
server { listen 80; server_name example.com; auth_basic "Restricted Access"; auth_basic_user_file /etc/nginx/htpasswd.users; location / { proxy_pass http://localhost:5601; proxy_http_version 1.1; proxy_set_header Upgrade $http_upgrade; proxy_set_header Connection 'upgrade'; proxy_set_header Host $host; proxy_cache_bypass $http_upgrade; } } |
Save and close the file. Create a symbolic link of the new configuration under the “sites-enabled” directory. If there exists any pre-existing link with the same file name, then this step may not be necessary:
|
1 |
sudo ln -s /etc/nginx/sites-available/example.com /etc/nginx/sites-enabled/example.com |
The following command will prompt Nginx to check if there’s any syntax error:
|
1 |
sudo nginx -t |
If there’s any syntax issue, ensure that the contents of the file were placed properly. Next, restart the Nginx service:
|
1 |
sudo systemctl restart nginx |
Tell UFW to allow connection to Nginx:
|
1 |
sudo ufw allow 'Nginx Full' |
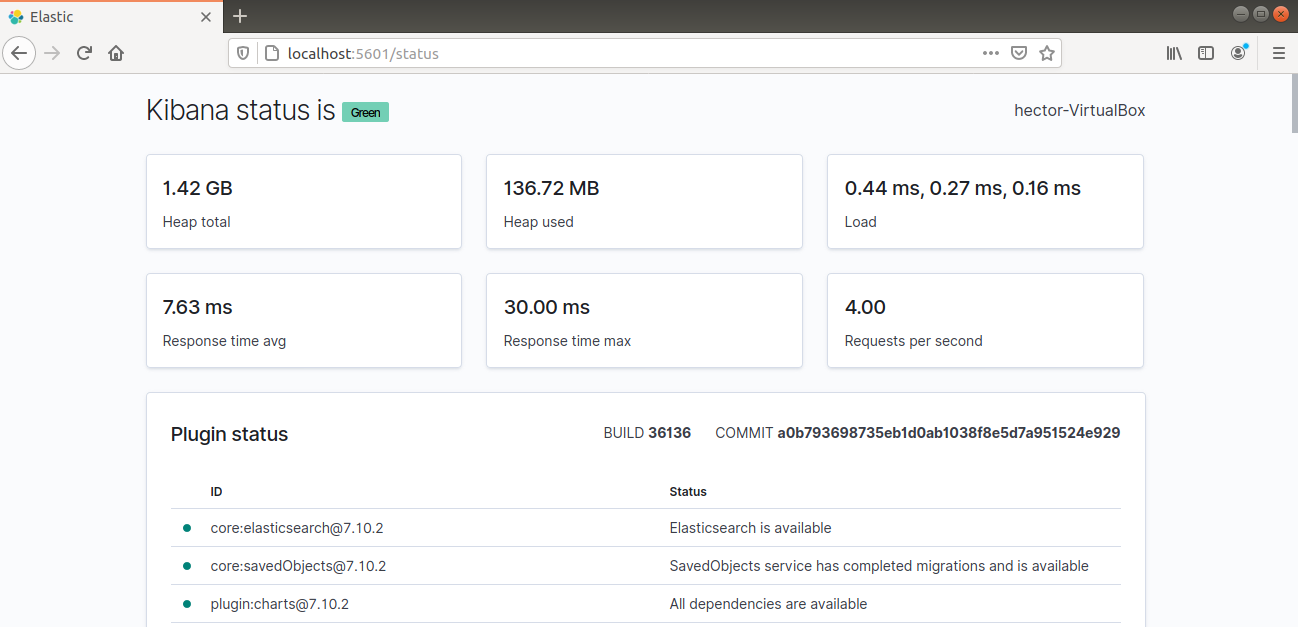
Kibana should now be accessible via the FQDN or the public IP address of the Elastic Stack server. Check the Kibana server’s status page:
|
1 |
http://<server_ip>:5601/status |
Installing and Configuring Logstash
While Beats can directly send data to Elasticsearch’s database, it’s recommended to use Logstash for processing the data. Logstash can collect the data and convert them into a common format before exporting to another database. Run the following APT command to install Logstash:
|
1 |
sudo apt install logstash |
Once the installation is complete, it’s time to configure Logstash. The configuration files of Logstash are in JSON format. You can find all of them in the “/etc/logstash/conf.d” directory. It’s helpful to think of Logstash as a pipeline, taking in data at one end, processing it, and sending it out to the destination. A Logstash pipeline requires two mandatory elements – input and output with one optional element – filter. The input plugin takes the data in, the filter plugin processes the data, and the output plugin writes the data to the destination. The following command will create a configuration file that will set Logstash for Filebeat input:
|
1 |
sudo vim /etc/logstash/conf.d/02-beats-input.conf |
Enter the following input configuration. It describes a beats input that will listen on port 5044 on TCP:
|
1 2 3 4 5 |
input { beats { port => 5044 } } |
The next step is to create a configuration file called “10-syslog-filter.conf.” We will use it for setting a filter for syslogs (system logs):
|
1 |
sudo vim /etc/logstash/conf.d/10-syslog-filter.conf |
Enter the following syslog configuration code. This code is available directly from the Elastic guide. This code explains the input configuration to Logstash:
|
1 2 3 4 5 6 7 8 9 10 11 12 13 14 15 16 17 18 19 20 21 22 23 24 25 26 27 28 29 30 31 32 33 34 35 36 37 38 39 40 41 42 |
input{ beats{ port => 5044 host => "0.0.0.0" } } filter { if [fileset][module] == "system" { if [fileset][name] == "auth" { grok { match => { "message" => ["%{SYSLOGTIMESTAMP:[system][auth][timestamp]} %{SYSLOGHOST:[system][auth][hostname]} sshd(?:\[%{POSINT:[system][auth][pid]}\])?: %{DATA:[system][auth][ssh][event]} %{DATA:[system][auth][ssh][method]} for (invalid user )?%{DATA:[system][auth][user]} from %{IPORHOST:[system][auth][ssh][ip]} port %{NUMBER:[system][auth][ssh][port]} ssh2(: %{GREEDYDATA:[system][auth][ssh][signature]})?", "%{SYSLOGTIMESTAMP:[system][auth][timestamp]} %{SYSLOGHOST:[system][auth][hostname]} sshd(?:\[%{POSINT:[system][auth][pid]}\])?: %{DATA:[system][auth][ssh][event]} user %{DATA:[system][auth][user]} from %{IPORHOST:[system][auth][ssh][ip]}", "%{SYSLOGTIMESTAMP:[system][auth][timestamp]} %{SYSLOGHOST:[system][auth][hostname]} sshd(?:\[%{POSINT:[system][auth][pid]}\])?: Did not receive identification string from %{IPORHOST:[system][auth][ssh][dropped_ip]}", "%{SYSLOGTIMESTAMP:[system][auth][timestamp]} %{SYSLOGHOST:[system][auth][hostname]} sudo(?:\[%{POSINT:[system][auth][pid]}\])?: \s*%{DATA:[system][auth][user]} :( %{DATA:[system][auth][sudo][error]} ;)? TTY=%{DATA:[system][auth][sudo][tty]} ; PWD=%{DATA:[system][auth][sudo][pwd]} ; USER=%{DATA:[system][auth][sudo][user]} ; COMMAND=%{GREEDYDATA:[system][auth][sudo][command]}", "%{SYSLOGTIMESTAMP:[system][auth][timestamp]} %{SYSLOGHOST:[system][auth][hostname]} groupadd(?:\[%{POSINT:[system][auth][pid]}\])?: new group: name=%{DATA:system.auth.groupadd.name}, GID=%{NUMBER:system.auth.groupadd.gid}", "%{SYSLOGTIMESTAMP:[system][auth][timestamp]} %{SYSLOGHOST:[system][auth][hostname]} useradd(?:\[%{POSINT:[system][auth][pid]}\])?: new user: name=%{DATA:[system][auth][user][add][name]}, UID=%{NUMBER:[system][auth][user][add][uid]}, GID=%{NUMBER:[system][auth][user][add][gid]}, home=%{DATA:[system][auth][user][add][home]}, shell=%{DATA:[system][auth][user][add][shell]}$", "%{SYSLOGTIMESTAMP:[system][auth][timestamp]} %{SYSLOGHOST:[system][auth][hostname]} %{DATA:[system][auth][program]}(?:\[%{POSINT:[system][auth][pid]}\])?: %{GREEDYMULTILINE:[system][auth][message]}"] } pattern_definitions => { "GREEDYMULTILINE"=> "(.|\n)*" } remove_field => "message" } date { match => [ "[system][auth][timestamp]", "MMM d HH:mm:ss", "MMM dd HH:mm:ss" ] } geoip { source => "[system][auth][ssh][ip]" target => "[system][auth][ssh][geoip]" } } else if [fileset][name] == "syslog" { grok { match => { "message" => ["%{SYSLOGTIMESTAMP:[system][syslog][timestamp]} %{SYSLOGHOST:[system][syslog][hostname]} %{DATA:[system][syslog][program]}(?:\[%{POSINT:[system][syslog][pid]}\])?: %{GREEDYMULTILINE:[system][syslog][message]}"] } pattern_definitions => { "GREEDYMULTILINE" => "(.|\n)*" } remove_field => "message" } date { match => [ "[system][syslog][timestamp]", "MMM d HH:mm:ss", "MMM dd HH:mm:ss" ] } } } } |
The next configuration file is going to deal with the output. Open a new file called “30-elasticsearch-output.conf:”
|
1 |
sudo vim /etc/logstash/conf.d/30-elasticsearch-output.conf |
Enter the following code. This code explains the output configuration to Logstash:
|
1 2 3 4 5 6 7 |
output { elasticsearch { hosts => ["localhost:9200"] manage_template => false index => "%{[@metadata][beat]}-%{[@metadata][version]}-%{+YYYY.MM.dd}" } } |
Test the Logstash configuration. Then, run the following command:
|
1 |
sudo -u logstash /usr/share/logstash/bin/logstash --path.settings /etc/logstash -t |
If there’s no error, then Logstash will print the following success message. If it wasn’t successful, then ensure that all the configuration files have the proper codes. Finally, start and enable the Logstash service:
|
1 2 |
sudo systemctl start logstash sudo systemctl enable logstash |
Now that Logstash is running successfully and is fully configured, let’s install Filebeat.
Installing and Configuring Filebeat
The Elastic Stack uses data shippers, known as “Beats” for collecting data from various sources and transporting those to Logstash/Elasticsearch. Here’s a shortlist of the available Beats from Elastic:
- Filebeat: Collecting/shippingLog files.
- Metricbeat: Collecting/shipping metrics from systems and services.
- Packetbeat: Collecting/analyzing network data.
- Winlogbeat: Collecting Windows event logs.
- Auditbeat: Collecting Linux audit framework data and monitoring file integrity.
- Heartbeat: Monitoring services for their availability.
For the purpose of this tutorial, we’ll be needing Filebeat to ship local logs to Elastic Stack. First, install Filebeat:
|
1 |
sudo apt install filebeat |
You can now configure Filebeat. First, it needs to connect to Logstash. We will be using the example configuration that comes with Filebeat. Open the configuration file in a text editor. Note that because the file is in YAML format, proper indentation is important:
|
1 |
sudo vim /etc/filebeat/filebeat.yml |
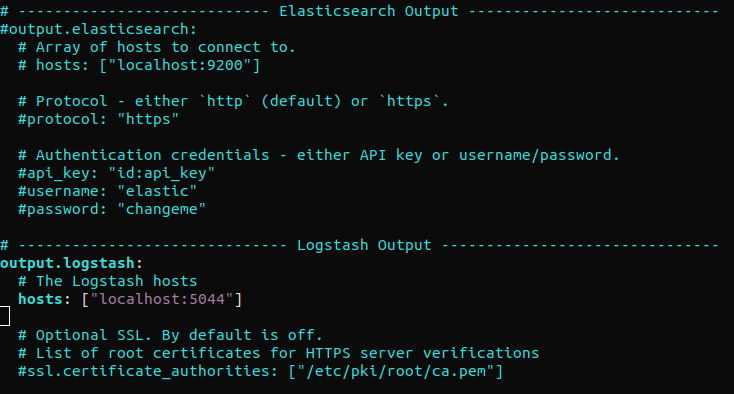
Find out the section “output.elasticsearch” and comment out the following lines. It will configure Filebeat to directly send events to Elasticsearch/Logstash for additional processing. Next, jump to the section “output.logstash.” Next, uncomment the lines:
|
1 2 3 4 5 6 7 |
#output.elasticsearch: # Array of hosts to connect to. # hosts: ["localhost:9200"] output.logstash: # The Logstash hosts hosts: ["localhost:5044"] |
Filebeat supports modules that can extend its functionality. In this tutorial, we will use the system module that collects and parses logs generated by the system logging service of common Linux distros. Enable the Filebeat system module:
|
1 |
sudo filebeat modules enable system |
The following Filebeat command will list all the enabled and disabled modules:
|
1 |
sudo filebeat modules list |
By default, Filebeat is set to follow the default paths for syslog and authorization logs. The parameters of the modules are available in the “/etc/filebeat/modules.d/system.yml” configuration file.
The next step is to load the index template into Elasticsearch. An Elasticsearch index denotes a collection of documents sharing similar features. Each index comes with a name. The name is necessary when performing various operations within it. The index template is automatically applied every time a new index is generated. Next, load the template:
|
1 |
sudo filebeat setup --template -E output.logstash.enabled=false -E 'output.elasticsearch.hosts=["localhost:9200"]' |
Filebeat contains a sample dashboard for Kibana by default. It helps to visualize Filebeat data in Kibana. However, before using the dashboard, it’s necessary to create the index pattern and load the dashboards into Kibana. While the dashboards load, Filebeat contacts Elasticsearch for version information. For loading dashboards, while Logstash is enabled, it is required to have Logstash output disabled and Elasticsearch output enabled. The following command will do the job:
|
1 |
sudo filebeat setup -e -E output.logstash.enabled=false -E output.elasticsearch.hosts=['localhost:9200'] -E setup.kibana.host=localhost:5601 |
Finally, you can launch Filebeat:
|
1 2 |
sudo systemctl start filebeat sudo systemctl enable filebeat |
Now, it’s time to test the Elastic Stack configuration. If it was properly configured, the output will look something like this:
|
1 |
curl -XGET 'http://localhost:9200/filebeat-*/_search?pretty' |

If the output reports 0 total hits, Elasticsearch is not loading any logs under the index that we searched for. It indicates that there was an error with the configuration. If the output was as expected, then the Elastic Stack is successfully configured.
Kibana Dashboards Overview
Now, it’s time to explore the Kibana web interface we have already installed. First, open the Kibana dashboard. It should be located at the FQDN or the public IP address of the Elastic Stack server:
|
1 |
http://<server_ip>:5601 |
Enter the login credentials that we generated before. Once logged in, the dashboard will look like this:
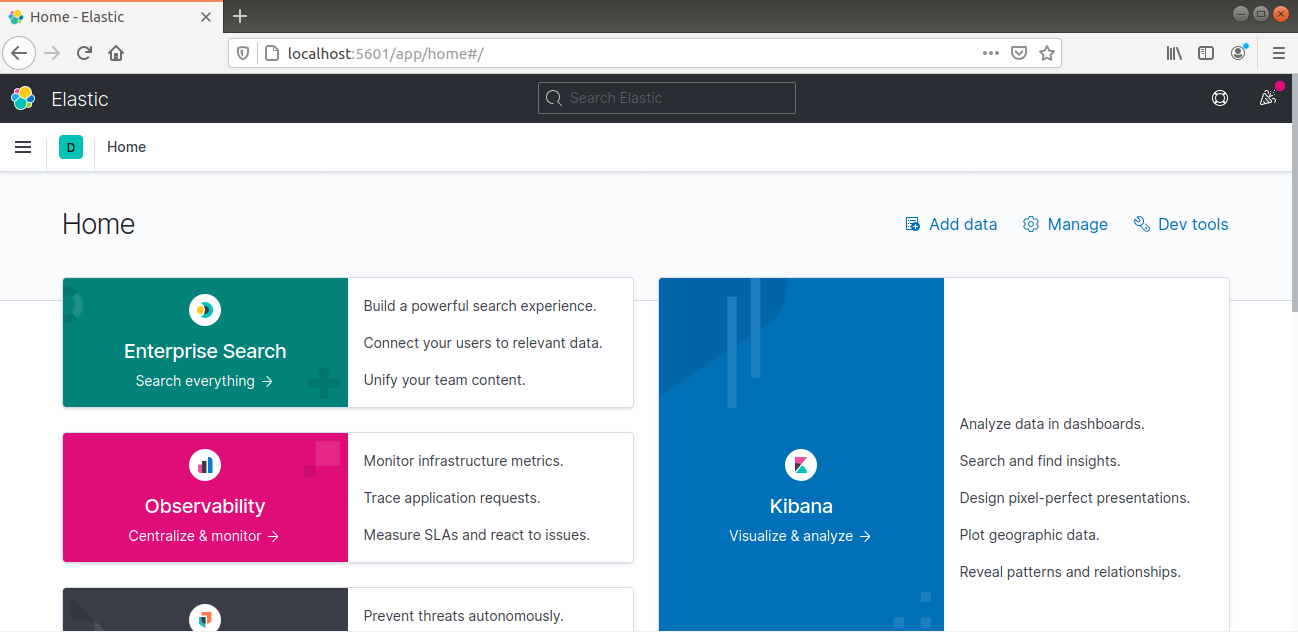
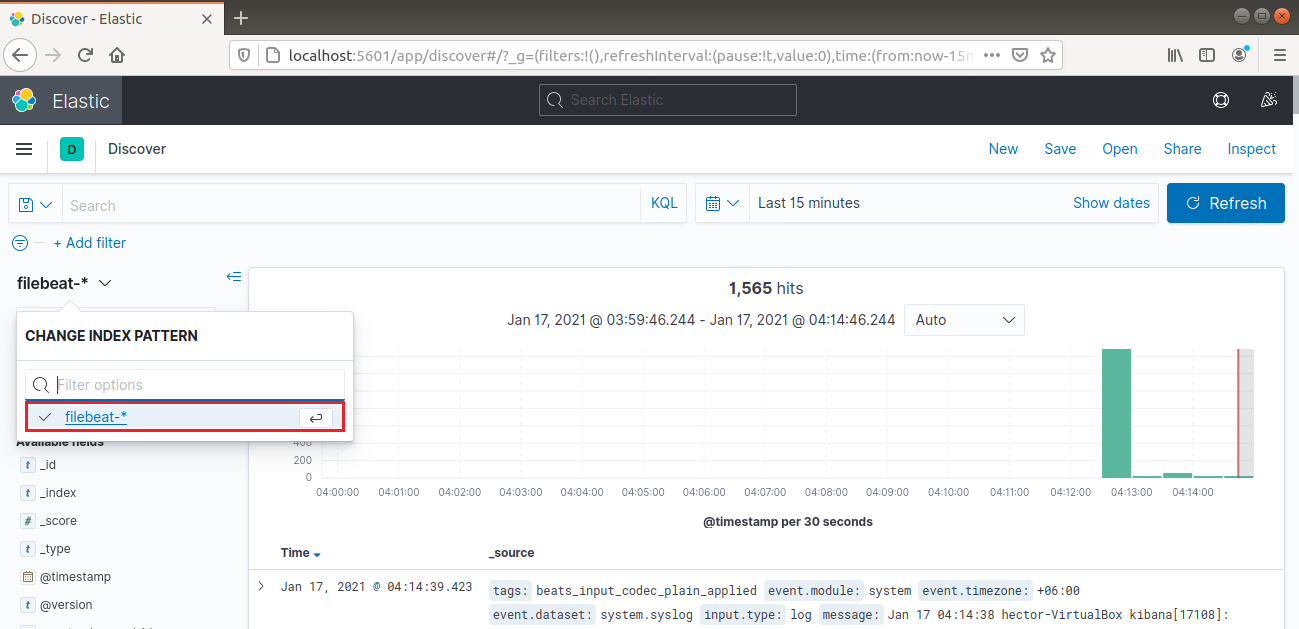
From the left navigation bar, select “Discover.” Then, select the “filebeat-*” pattern. It shows all the logs collected over the last 15 minutes. It’s possible to search and browse logs and customize the dashboard:
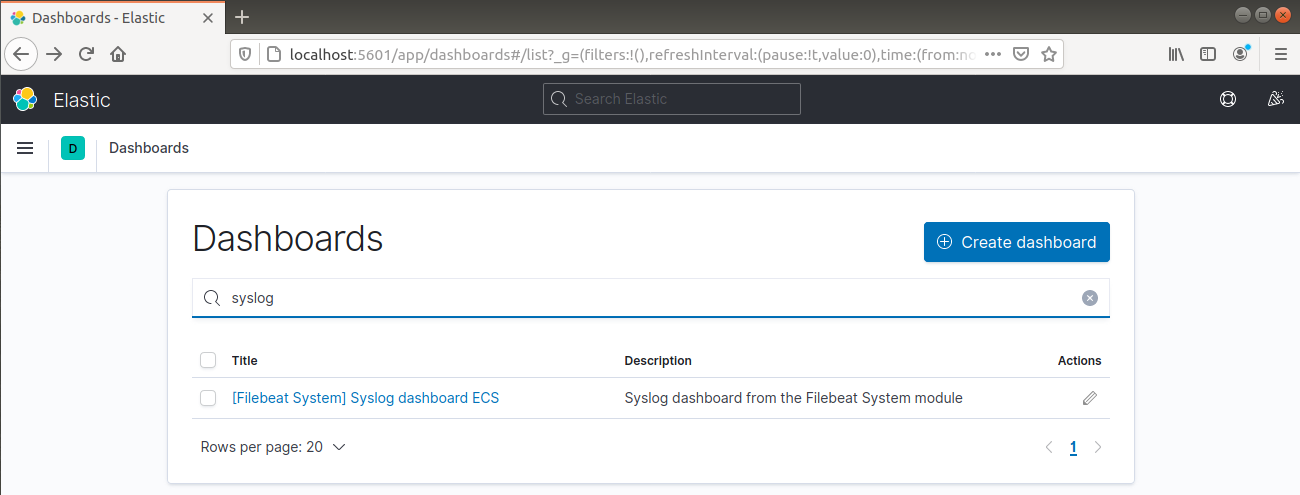
From the left navigation bar, go to Dashboard >> Filebeat System. Here, all the sample dashboards from Filebeat’s system module are available.
In the following example, it details various stats based on the syslog messages:
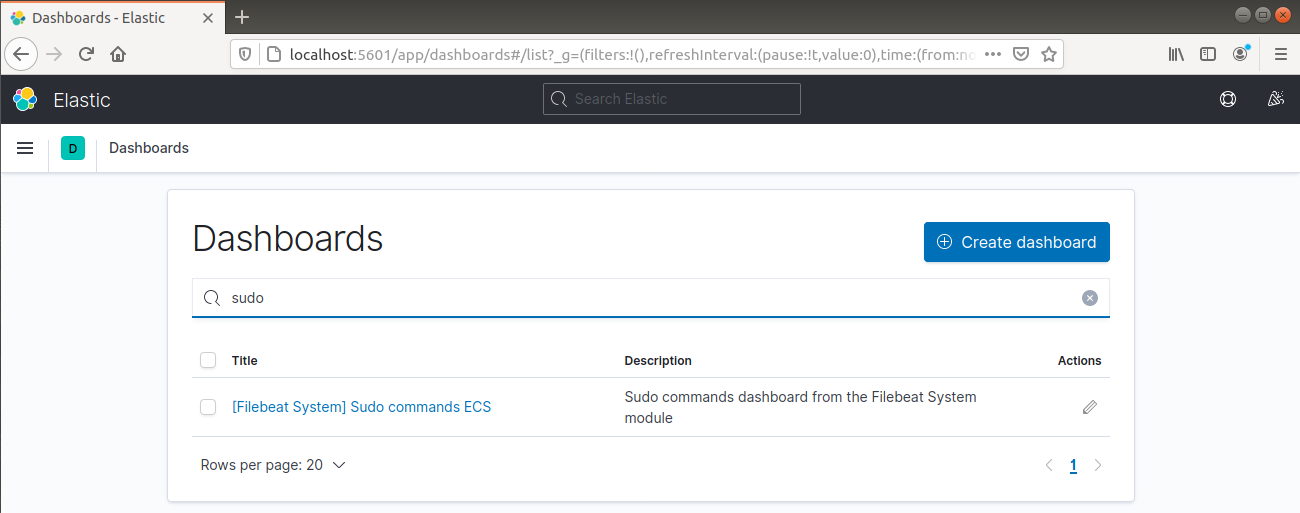
It can also report which users have executed commands with sudo:
Finally, Kibana gives you the opportunity to explore many other functionalities such as graphing and filtering, so feel free to explore on your own.
Final Thoughts
The Elastic Stack is a powerful solution for analyzing system logs. Keep in mind that while any log or indexed data can be sent to Logstash using Beats, it becomes more useful when parsed and structured through Logstash filters.
Happy computing!
- How To Enable, Create and Use the .htaccess File: A Tutorial - March 8, 2023
- An Overview of Queries in MySQL - October 28, 2022
- Introduction to Cookies: Understanding and Working with JavaScript Cookies - October 25, 2022
- An Overview of Data Types in Ruby - October 24, 2022
- The Architecture of Iptables and Netfilter - October 10, 2022