


You have finally managed to get up and running with your application. It runs great. You’re happy and you’re customers are happy. One morning you wake up with an inbox full of angry customer emails and your Twitter feed full of complaints. While you were sleeping, something broke. You just didn’t know about it until this morning when you checked your email. You grab your laptop and try troubleshooting the issue. After 20 minutes, everything is up and running again. It was something simple. It only took a few minutes to fix once you found the root cause. Most of the time was spent on actually identifying the problem. While we all wish that these things wouldn’t happen, in the real world, they will happen. The question is what can we do to mitigate them and speed up the recovery when they do happen. In this article, I’ve compiled a short list of top tools and services that we see our own customers using on their deployment with us to help you out in these situations.
The tools are of course not a replacement of setting up a redundant infrastructure, but when things fail, they will help you with your cloud deployment swiftly. In some cases, such as a server running out of disk space, these tools could even save you from that outage by sending you a pro-active alert message.
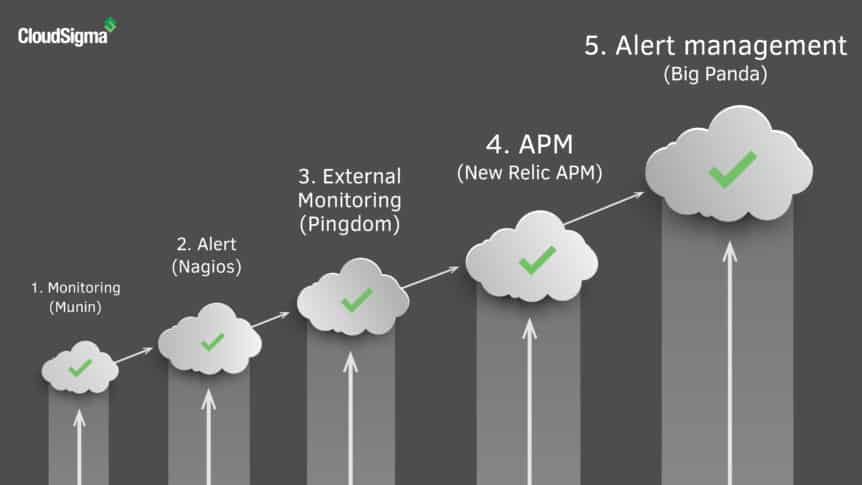
Monitoring: Munin
- tl;dr: Graph critical resources over time.
- Type: Self-hosted
- Website: munin-monitoring.org
- Alternative: Graphite, New Relic Server Monitoring, Server Density
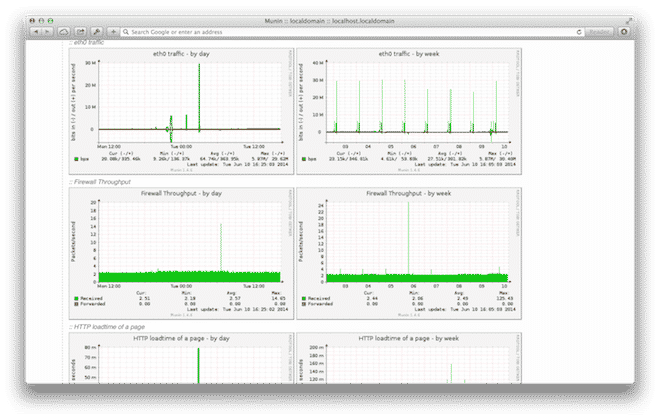
While tools like top (or htop) are great for displaying the current load on the cloud deployment, you often want to see the load on a server over time. This is where Munin comes into play. Munin is a client/server service that you run yourself. Each server you want to monitor requires the Munin agent installed. The Munin server will then connect to each client and collect the metrics specified.
By default, Munin comes with a lot of monitoring plug-ins, such as system resources (CPU, RAM disk, temperature etc), but also for a number other services, such as MySQL, Postfix etc.
One of the strengths with Munin is how easy it is to write your own plug-ins. You can write these plug-ins in more or less any language that can be run from the shell and return text as output (most plug-ins are written in Bash, Perl or Python).
Munin can also be configured to send alerts based on thresholds in the plug-ins, but compared to Nagios (below), this alerting is very limited.
Alerts: Nagios
- tl;dr: Get alerted when critical resources fail.
- Type: Self-hosted
- Website: nagios.org
- Alternative: Zabbix
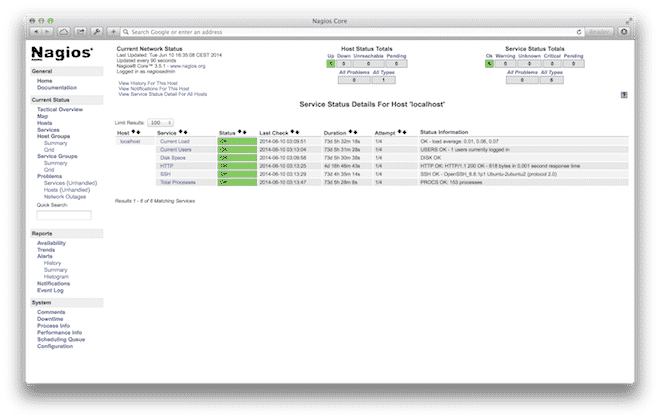
As mentioned above, Munin does have the ability to send alerts, but it doesn’t come close to Nagios. Today, Nagios is more or less the industry standard for monitoring internal resources. It may not be very pretty, but it is very powerful.
Similar to Munin, Nagios is a server/client type of service (although the client is only required for certain services).
It may take a bit of time to get used to the configuration syntax and structure of Nagios, but once you get your head around it, it is relatively simple to work with.
A simplistic Nagios setup could make sure that all your servers are accessible via Ping, SSH and the web, but there is a plethora of plug-ins available for Nagios to monitor all kind of services.
Nagios also comes with a number of alert methods. The simplest alert is to send out an email, but you can configure it to use a number of other channels, such as SMS also (using external services).
External Monitoring: Pingdom
- tl;dr: Ensure your services are accessible from across the globe.
- Type: SaaS
- Alternative: StatusCake
- Website: pingdom.com
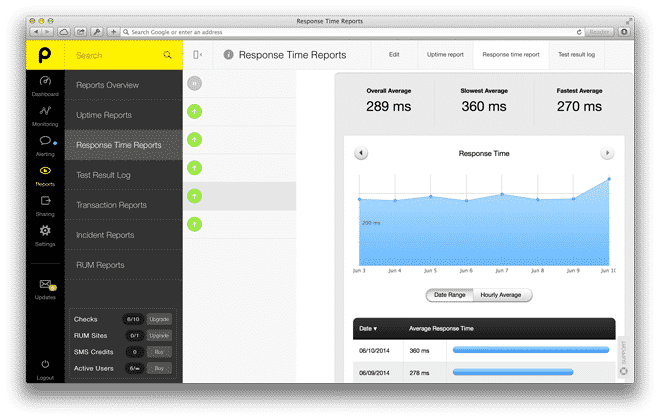
Nagios is great for monitoring internal resources, but it doesn’t tell you if your website is inaccessible due to a routing issue upstream. This is where Pingdom excels. It is possible to set up a number of different checks with Pingdom, but the most simplistic one is to do a check to ensure that a website is responding (i.e. returns a 200 HTTP status).
With Pingdom’s fleet of servers around the globe, you can sleep sound knowing that your website is up and what the response time is.
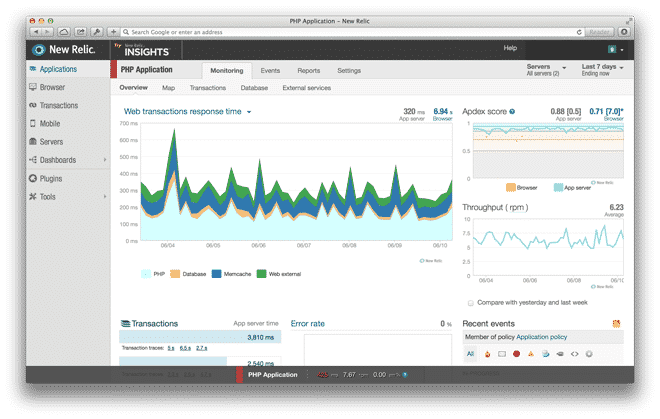
APM: New Relic APM
- tl;dr: Gain insight into your applications performance and pin-point bottlenecks.
- Type: SaaS
- Alternative: Rollbar
- Website: newrelic.com
Most teams will sooner or later run into the situation where their website/service starts to perform poorly. You notice that the load time increased radically, but where is the bottleneck? There are many things that could lead to the same behavior.
This is where New Relic’s Application Performance Monitor (APM) comes into play. With the agent installed, you can quickly pin-point the root cause.
Since New Relics’s APM requires access inside of your application, you will need to you integrate it into your application. Most of the popular application frameworks are supported.
Through our partnership with New Relic, you can sign up for New Relic directly inside of our webapp and get features that you wouldn’t get if you sign-up directly on their website.
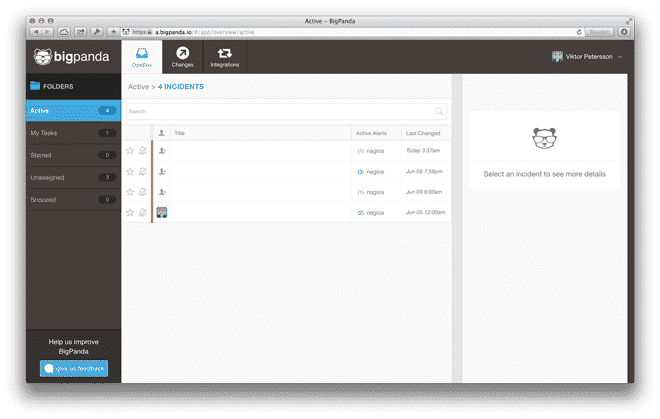
Alert management: Big Panda
- tl;dr: Make alerts more manageable within your team.
- Type: SaaS
- Website: bigpanda.io
- Alternative: PagerDuty
If you have a one-man-shop cloud deployment, simply getting email alerts may be sufficient. There might be a lot of them at a time when something goes wrong, but you are on top of it.
Chances are however that you’re working in a team with multiple people involved. This is where Big Panda comes into play. You can configure most of the tools mentioned above to report to Big Panda, in which you can have a unified dashboard and assign issues to work faster to resolve the issue at hand.
Summary
I hope that the above tools give you a good overview of complementary services to help your cloud deployment. There are of course a lot of other tools similar to the ones mentioned in this article, but the idea is that you will likely want to have one of tools in each of the above categories.
You may also want to take a look at the article “An introduction to failover in the cloud” walks you through how to set up a simple failover setup.
- Manage Docker resources with Cgroups - May 12, 2015
- Docker, Cgroups & More from ApacheCon 2015 - April 30, 2015
- How to setup & optimise MongoDB on public cloud servers - March 24, 2015
- Presentation deck from CloudExpo Europe - March 17, 2015
- CoreOS is now available on CloudSigma! - March 10, 2015