
The following is a detailed guide that will help you become familiar with the CloudSigma PaaS Dashboard. We will go over all of the different features, tools, and icons you can interact with on the user interface to create and modify your project.
You need to follow along with this tutorial on the CloudSigma PaaS platform. This way, you can locate items and understand their usage and functionality side by side. You can launch a free trial version here to get an idea of what the CloudSigma dashboard looks like.
Following are the functionalities of the CloudSigma PaaS platform that we will cover in this tutorial:
- Creating and Managing a New Environment
- Function Icons for an Environment
- Managing Environment Settings
- Function Icons for Each Instance
- How to Import
- Marketplace
- Creating Environment Groups
- Running a Dashboard Search
- Deployment Manager
- Tasks Panel
- Changing User Settings
- Upgrading Your Account
- Adding Balance
- Getting Help
Let’s begin!
Creating and Managing a New Environment
First, we shall learn how to create a new environment on the CloudSigma PaaS dashboard. Subsequently, we will learn about various tools which you can use for its management.
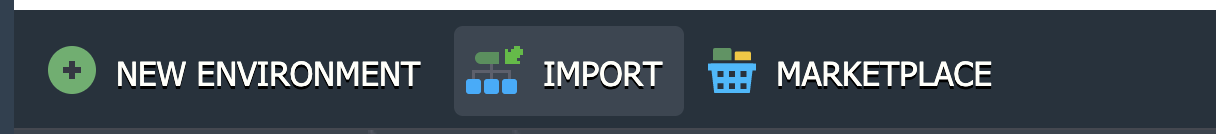
- First, locate and click on New Environment in the top left corner of the dashboard:
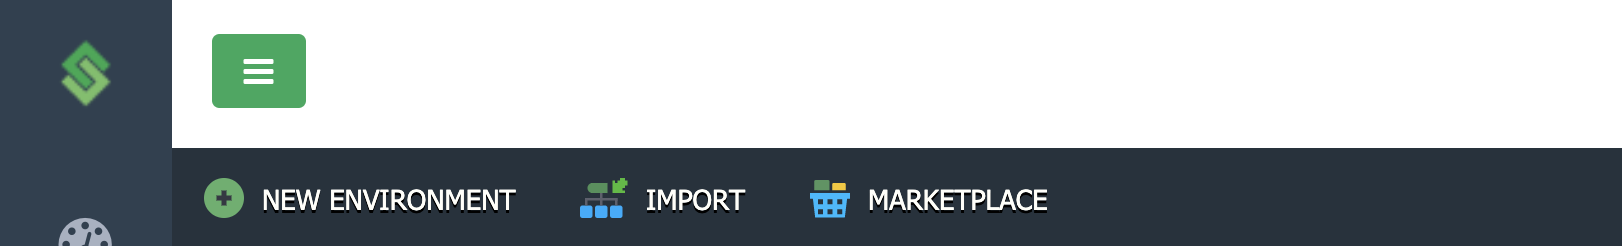
- Clicking on this will open up the Topology Wizard. This elaborate window gives you the power to fully customize your environment settings.
- Following are some of the elements you can configure as per your requirements:
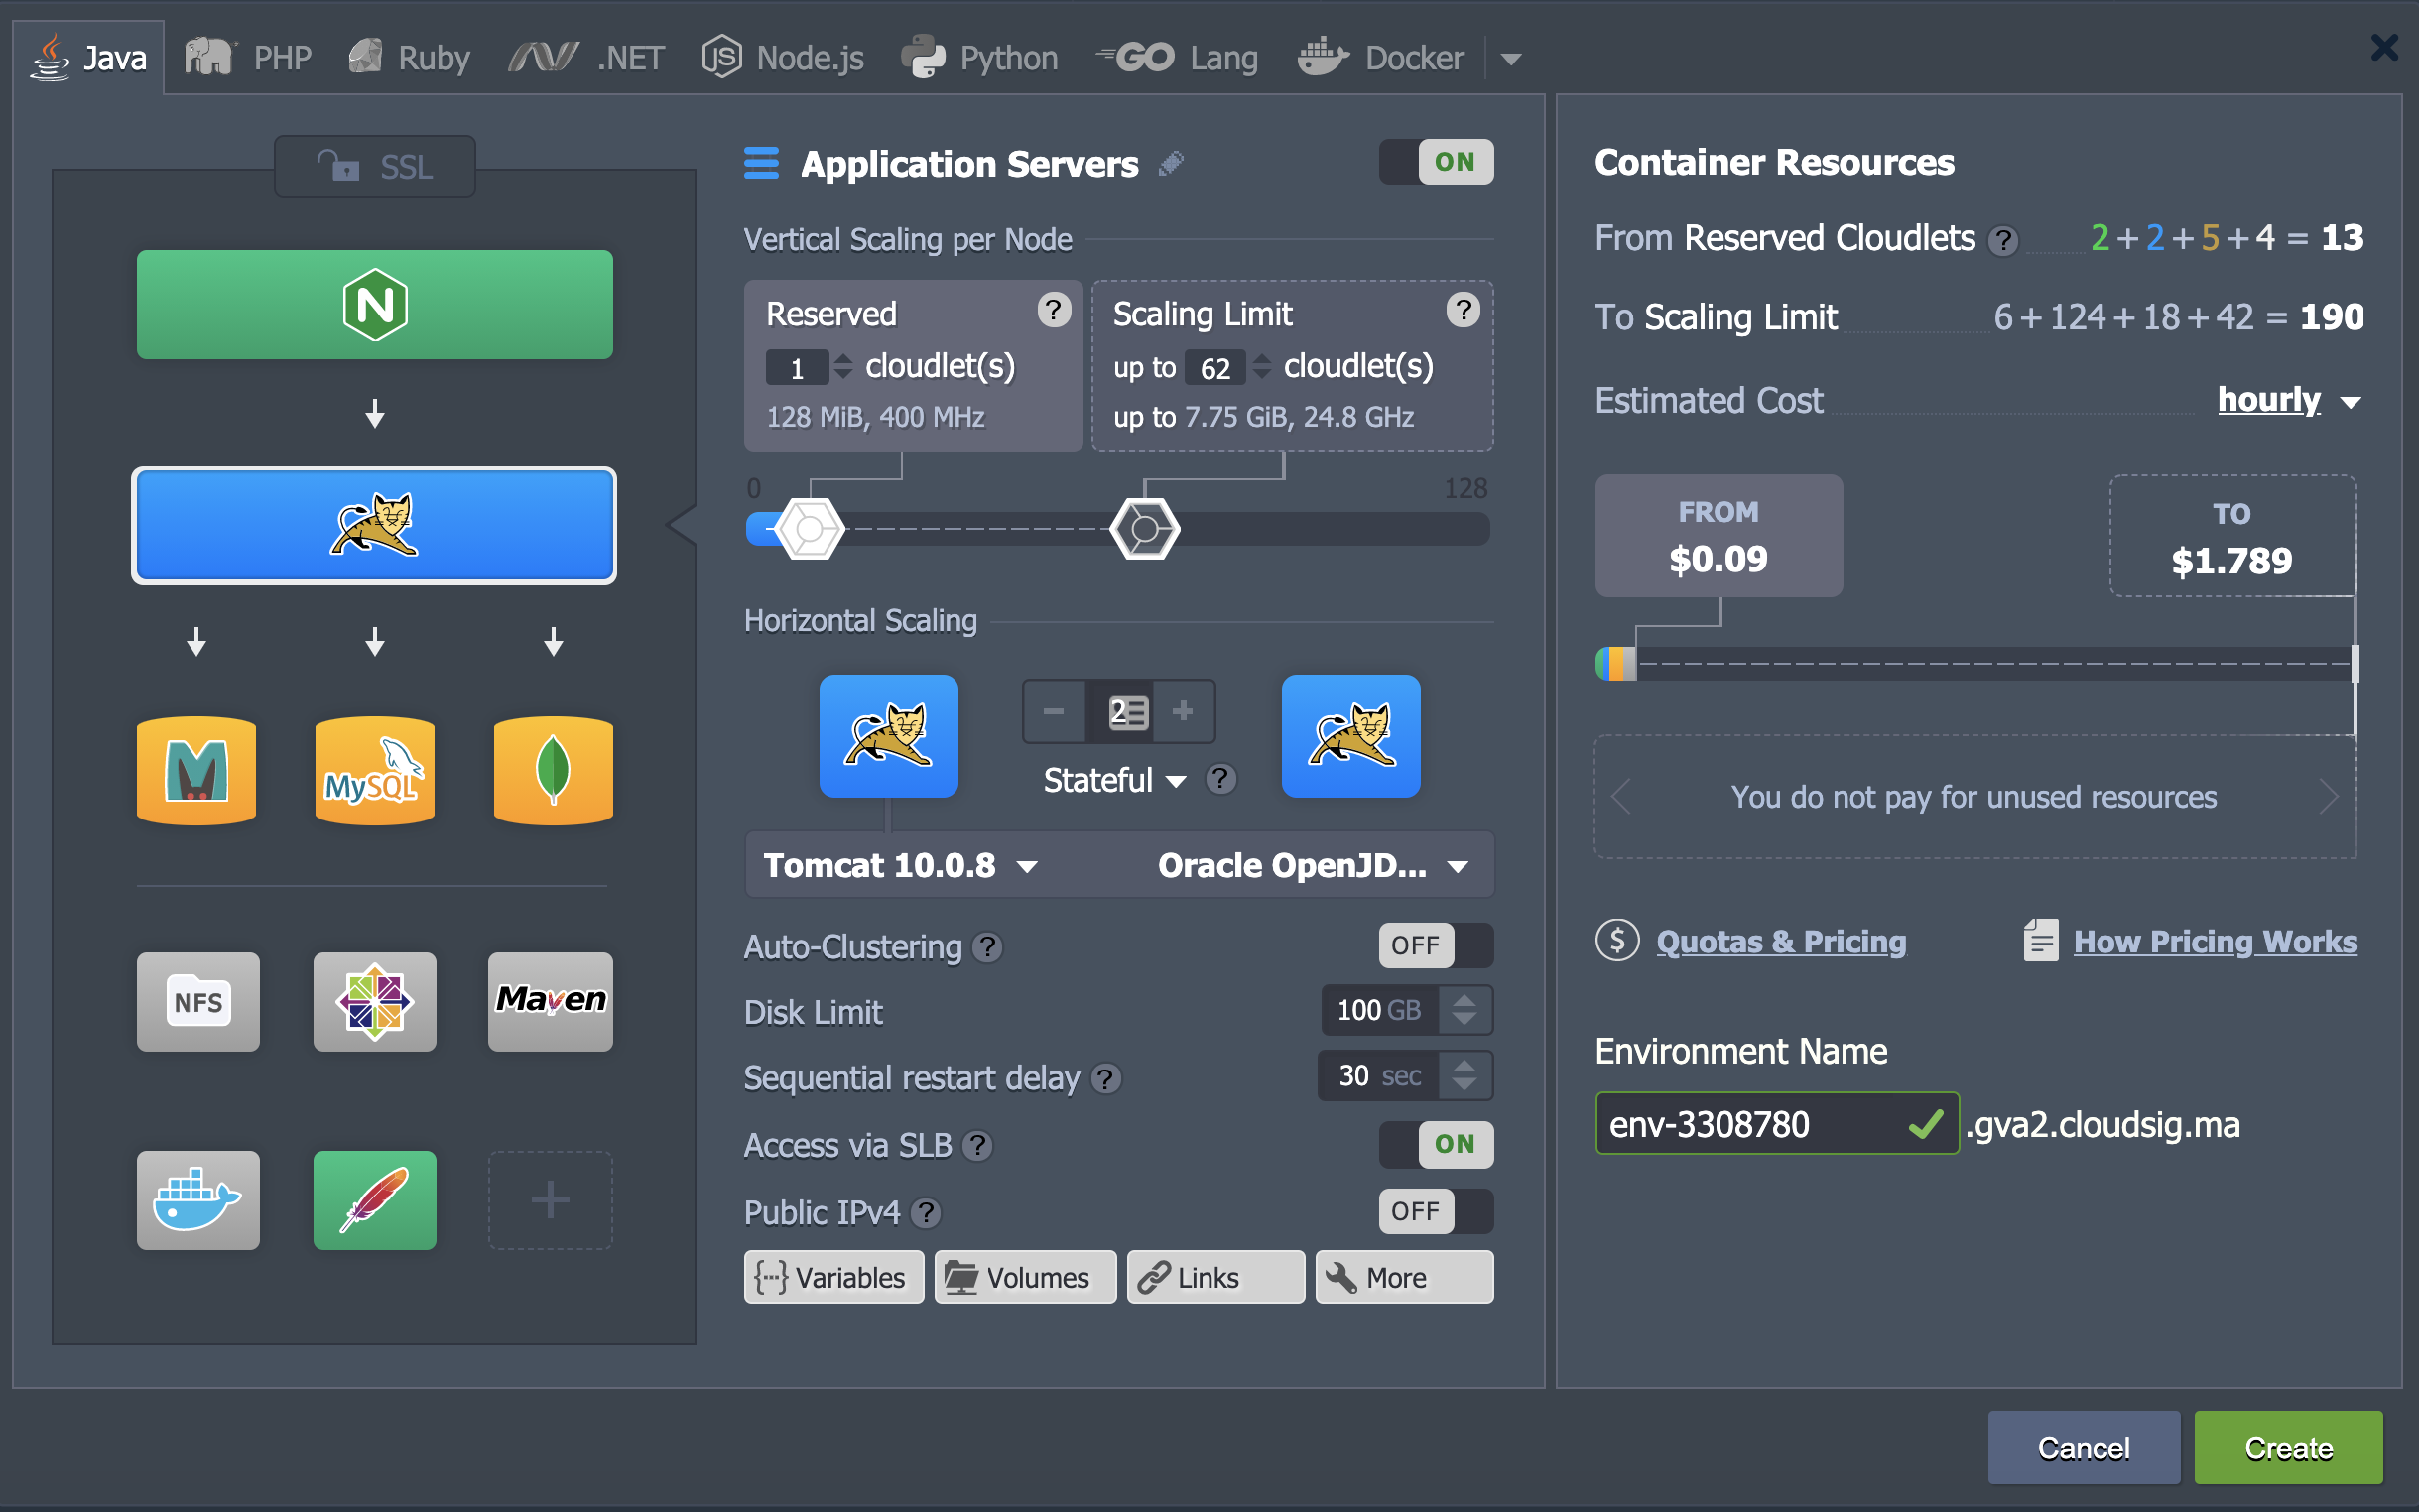
- Click on the Create button after you are done with the configuration and have set an Environment Name.
- You will be able to find your new environment by the selected Environment Name in the central panel on the dashboard:
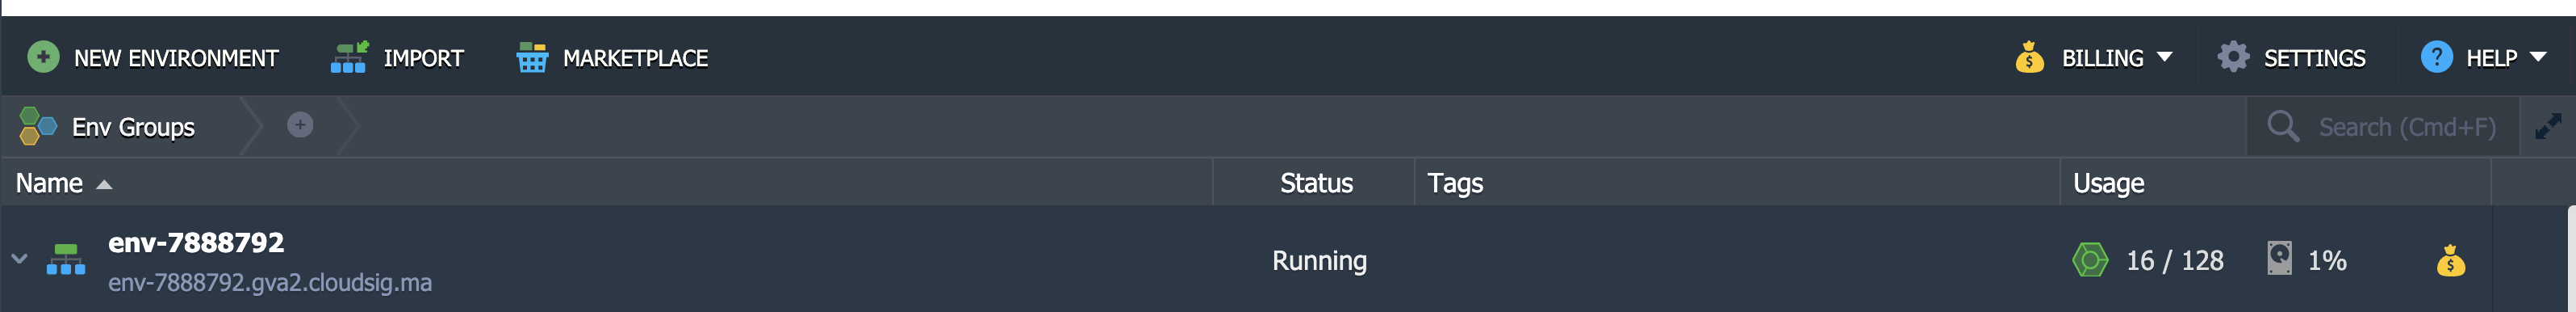
- The above panel gives you some fundamental information regarding your new environment. Below we will explain what each column signifies in more detail:
- Name
Under this column, you will find the name or alias of the environment. It will also display the domain of the environment with a flag for the region it is hosted in. To view the list of nodes included in a given environment, click on the small triangle next to the environment name.
- Status
This column indicates the current status of your given environment. It can be one of the following: Running, Sleeping, Stopped, Creating, Stopping, Cloning, Launching, Redeploying, Exporting, Migrating, Installing, or Deleting.
- Tags
In this column, you will be able to see all the Environment Groups that your environment belongs to. It will also show the versions (tags) of the containers with the name of the project.
- Usage
The usage column shows a percentage. It indicates the current load of the environment, such as disk space usage and cloudlets.
 Button
 Button
This button indicates the Billing History. Clicking on it will take you to a separate tab detailing your spending activity and statistics for this environment.
Function Icons for a Given Environment
If you hover your cursor over your environment, multiple function icons will appear. Following are the icons you can interact with on your dashboard to perform different management functions:
![]()
- Set Alias

An alias is an alternative name for the environment. Setting an alias does not affect your domain.
- Open in Browser

Clicking this icon will open the environment in a new browser tab.
- Settings

Clicking on Settings will open up a new tab with elaborate configuration panels that you can edit.
- Change Environment Topology

This function icon allows you to access the Topology Wizard dialog box and make the necessary edits. Click Apply to save your changes.
- Clone Environment

This option helps you clone the selected server. You will be asked to set a name for the new environment. Finally, click Clone to make a copy.
- Start
 / Stop
You will see the Start icon if your environment is currently stopped and vice versa. Click on either of these to Start/Stop the environment.
In case your environment status is currently Stopped, you will only be able to interact with the Settings, Clone Environment, Start, and Delete Environment buttons.
![]()
- Delete Environment

Hover over the server you want to remove and click on the Delete icon. You will be asked to enter your password to confirm the action.
- Add Env Groups
 / Edit Env Groups
You have to hover over the Tags column for these options to appear. These icons assist with the management of Environment Groups.
Managing Environments with Settings
Let’s explore all that you can achieve in the Environment Settings window. In this tab, you will see eleven different options dealing with various aspects of the environment. These are as follows:
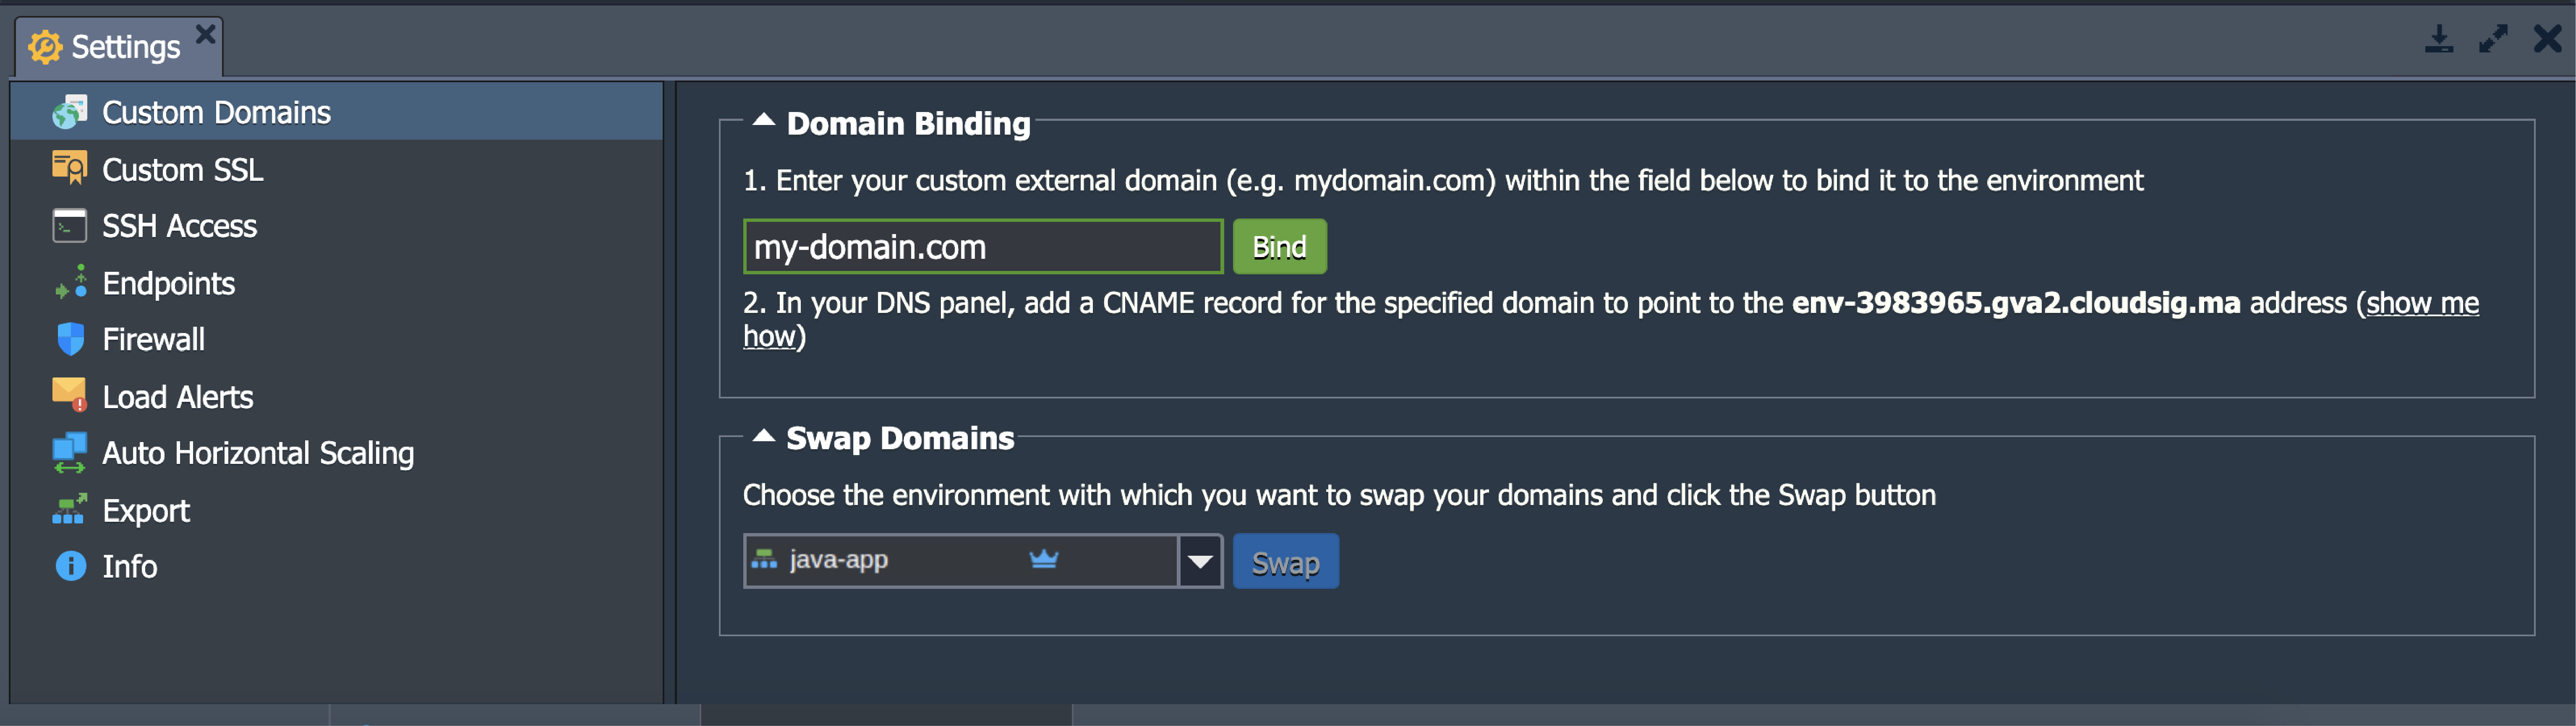
- Custom Domains
The Custom Domains option allows you to access the Domain Binding and Swap Domains sections:
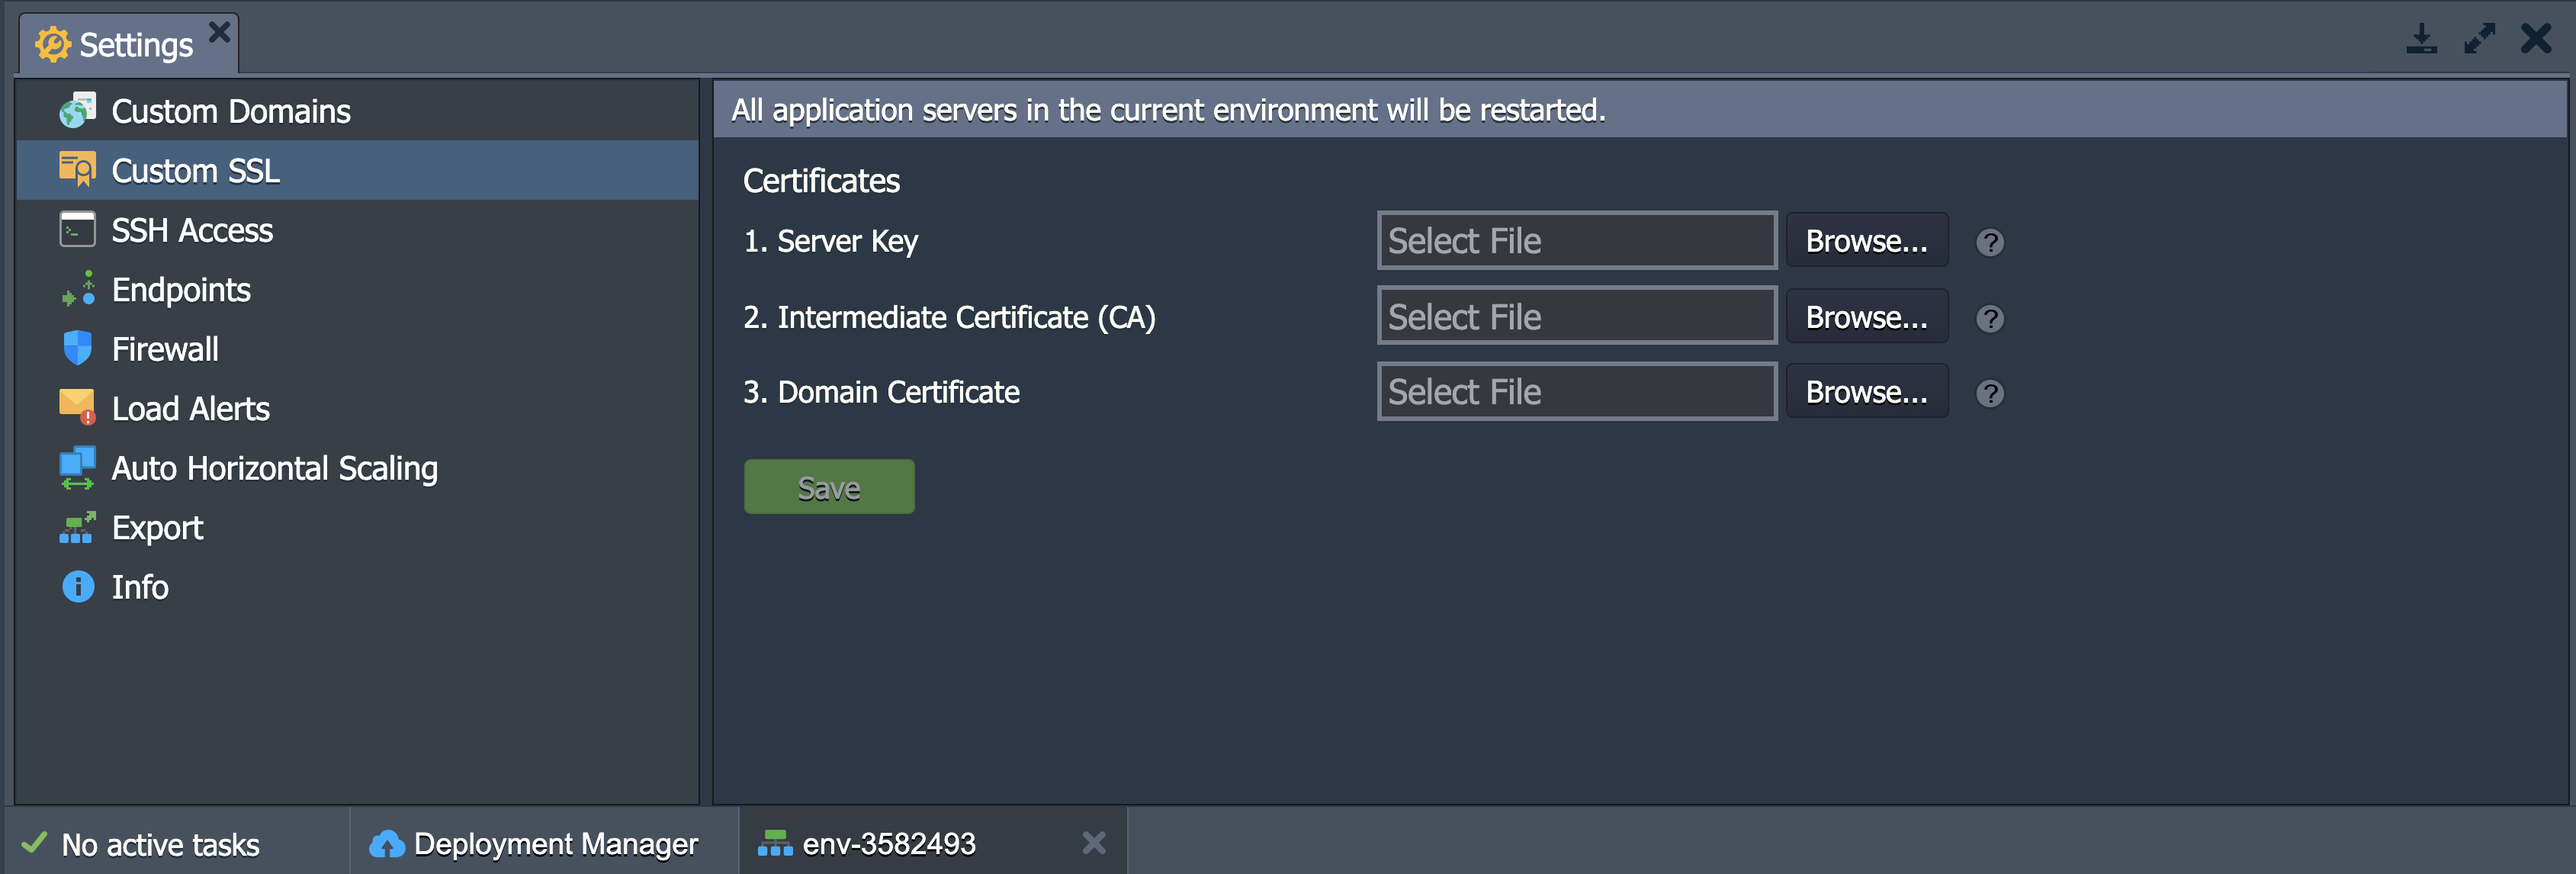
- Custom SSL
Here, you can upload all the files needed for your custom SSL certification:
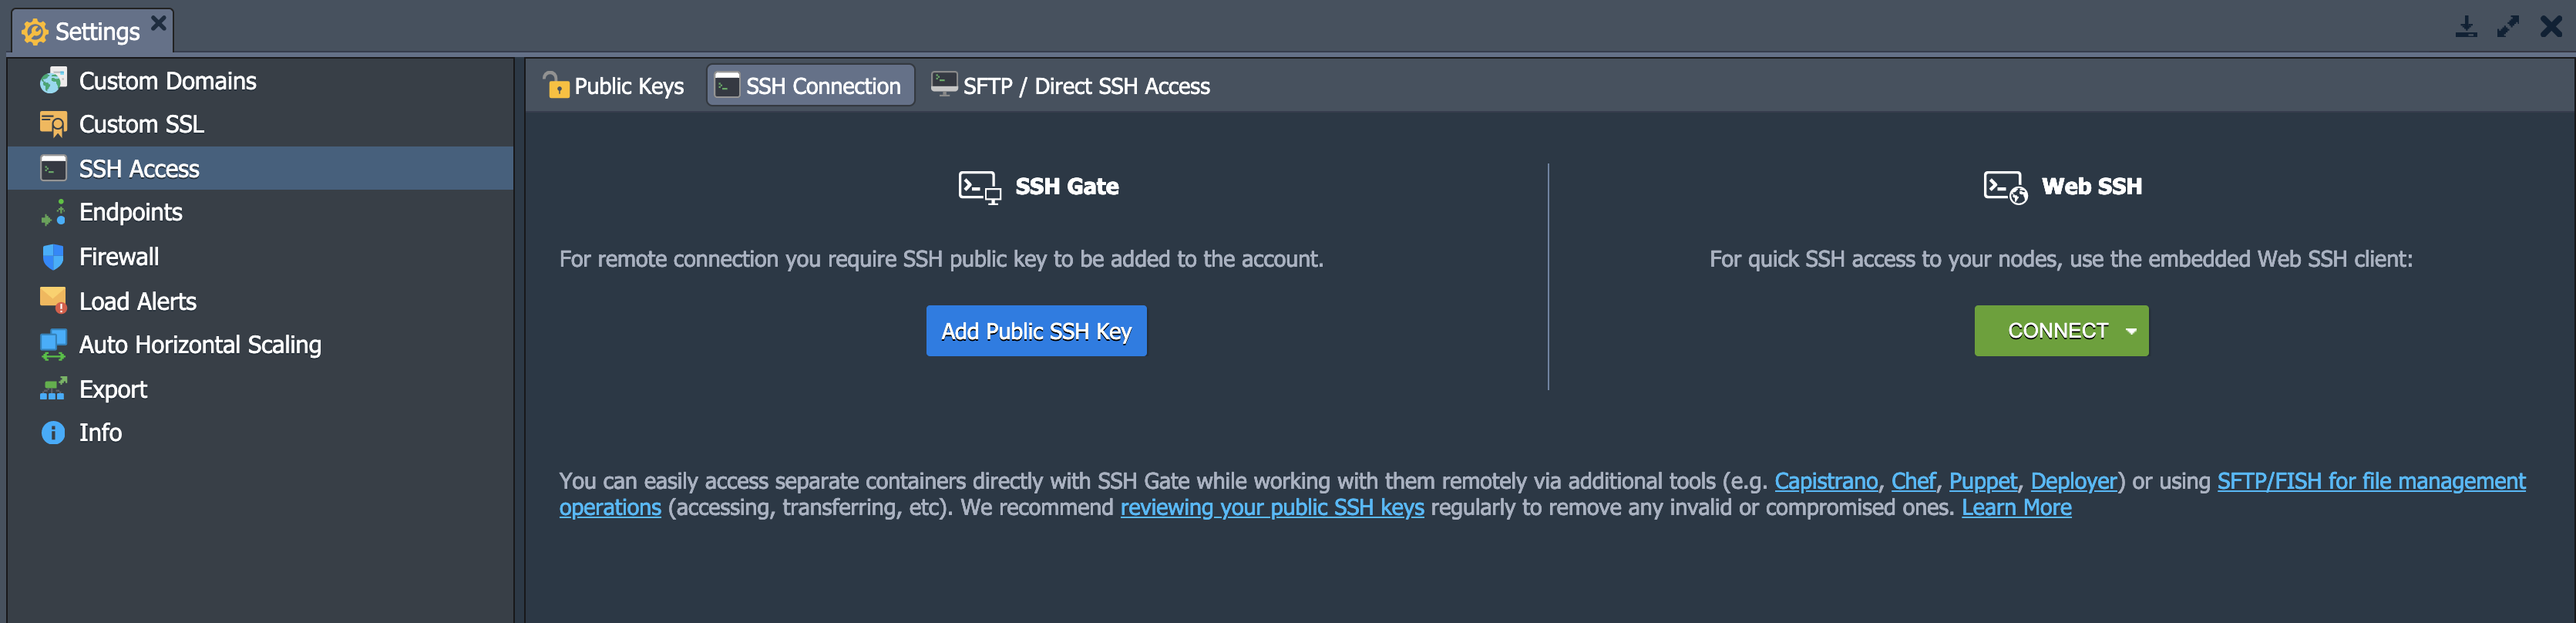
- SSH Access
In this section, you will find tabs for Public Keys, SSH Connection, and SFTP/Direct SSH Access. Through Public Keys, you can visualize and manage your public SSH keys. In the SSH Connection section, you can determine whether to access your via SSH Gate or Web SSH. Lastly, you can view the details of your connection over the SFTP/FISH protocols:
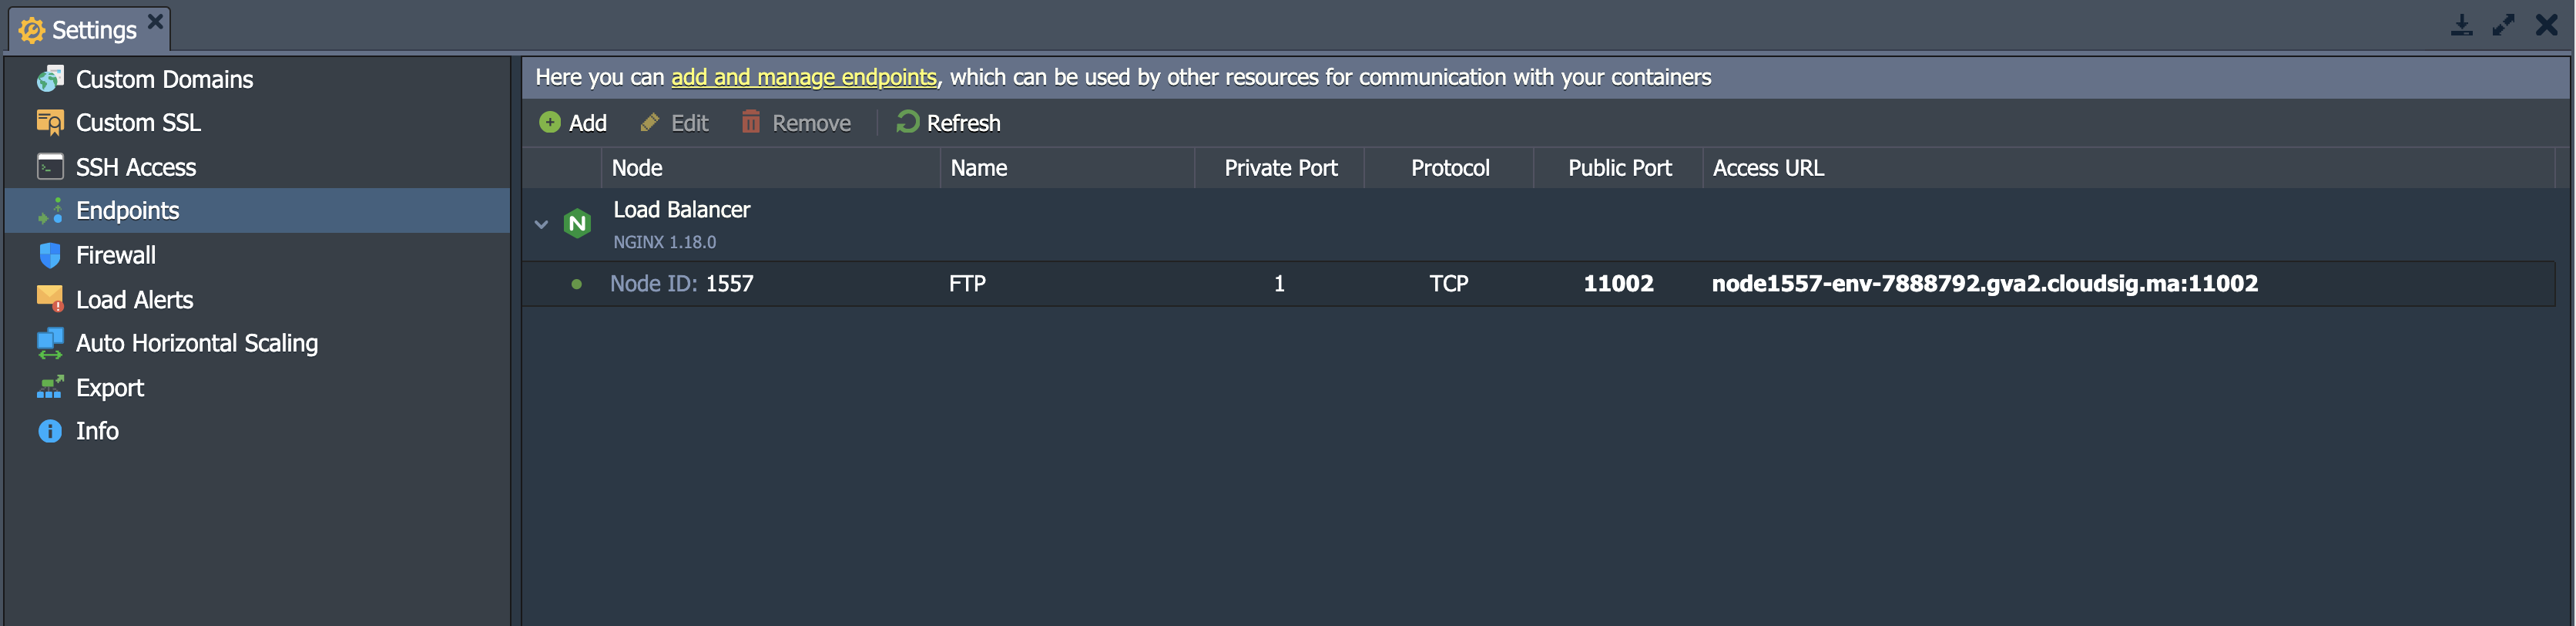
- Endpoints
This section allows you to determine and manage the mapping of your container’s TCP/UDP ports. This is to make sure that your ports are working in collaboration with external resources through direct connections:
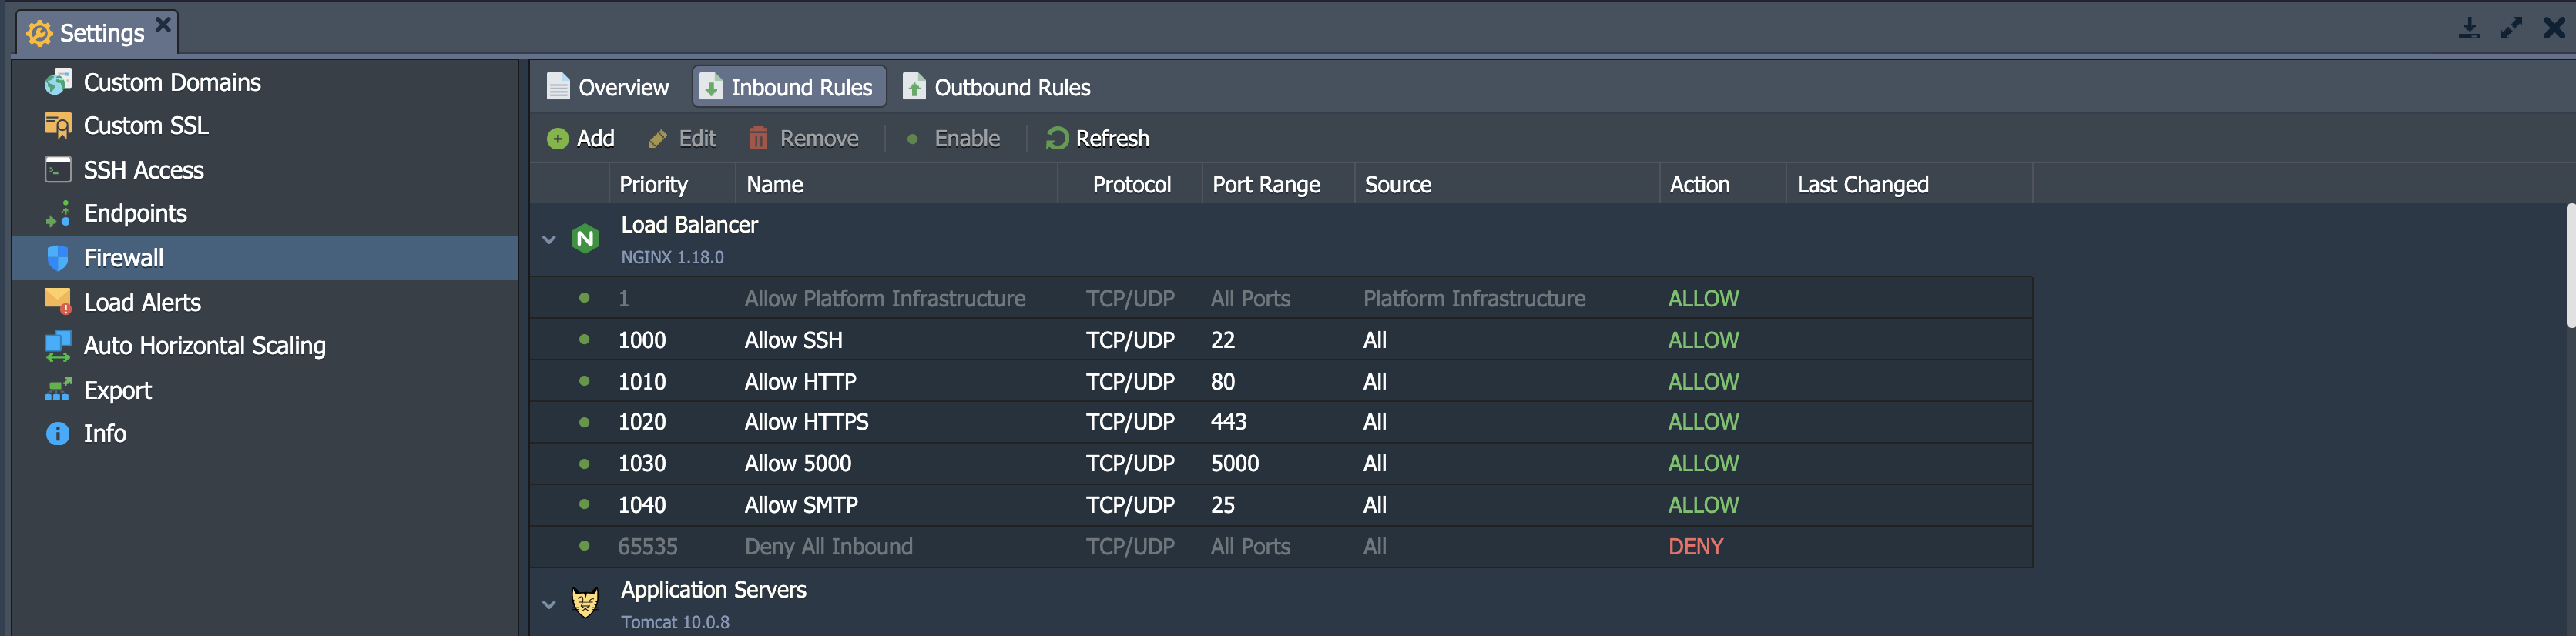
- Firewall
Under Firewall, you can determine your personal Inbound and Outbound rules. You can allow and block certain connections as per your requirements. This allows you to set custom access for your containers:
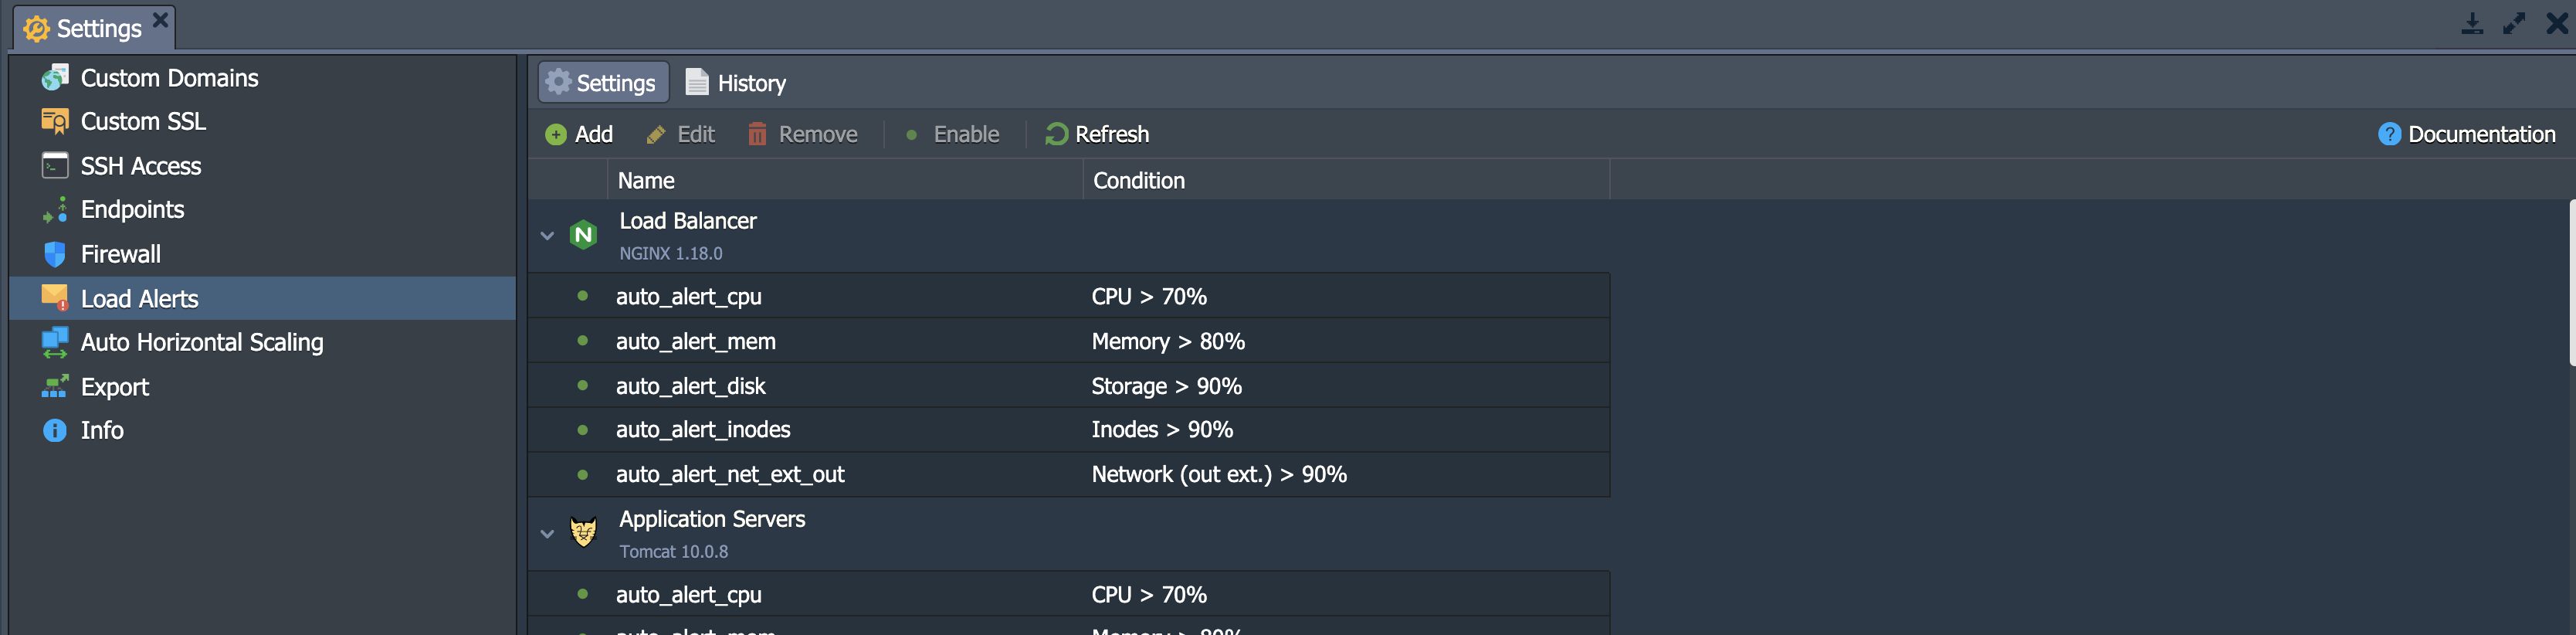
- Load Alerts
The subsection can be used to set and manage triggers (default or new) for email notifications in case limits of resource consumption are exceeded.
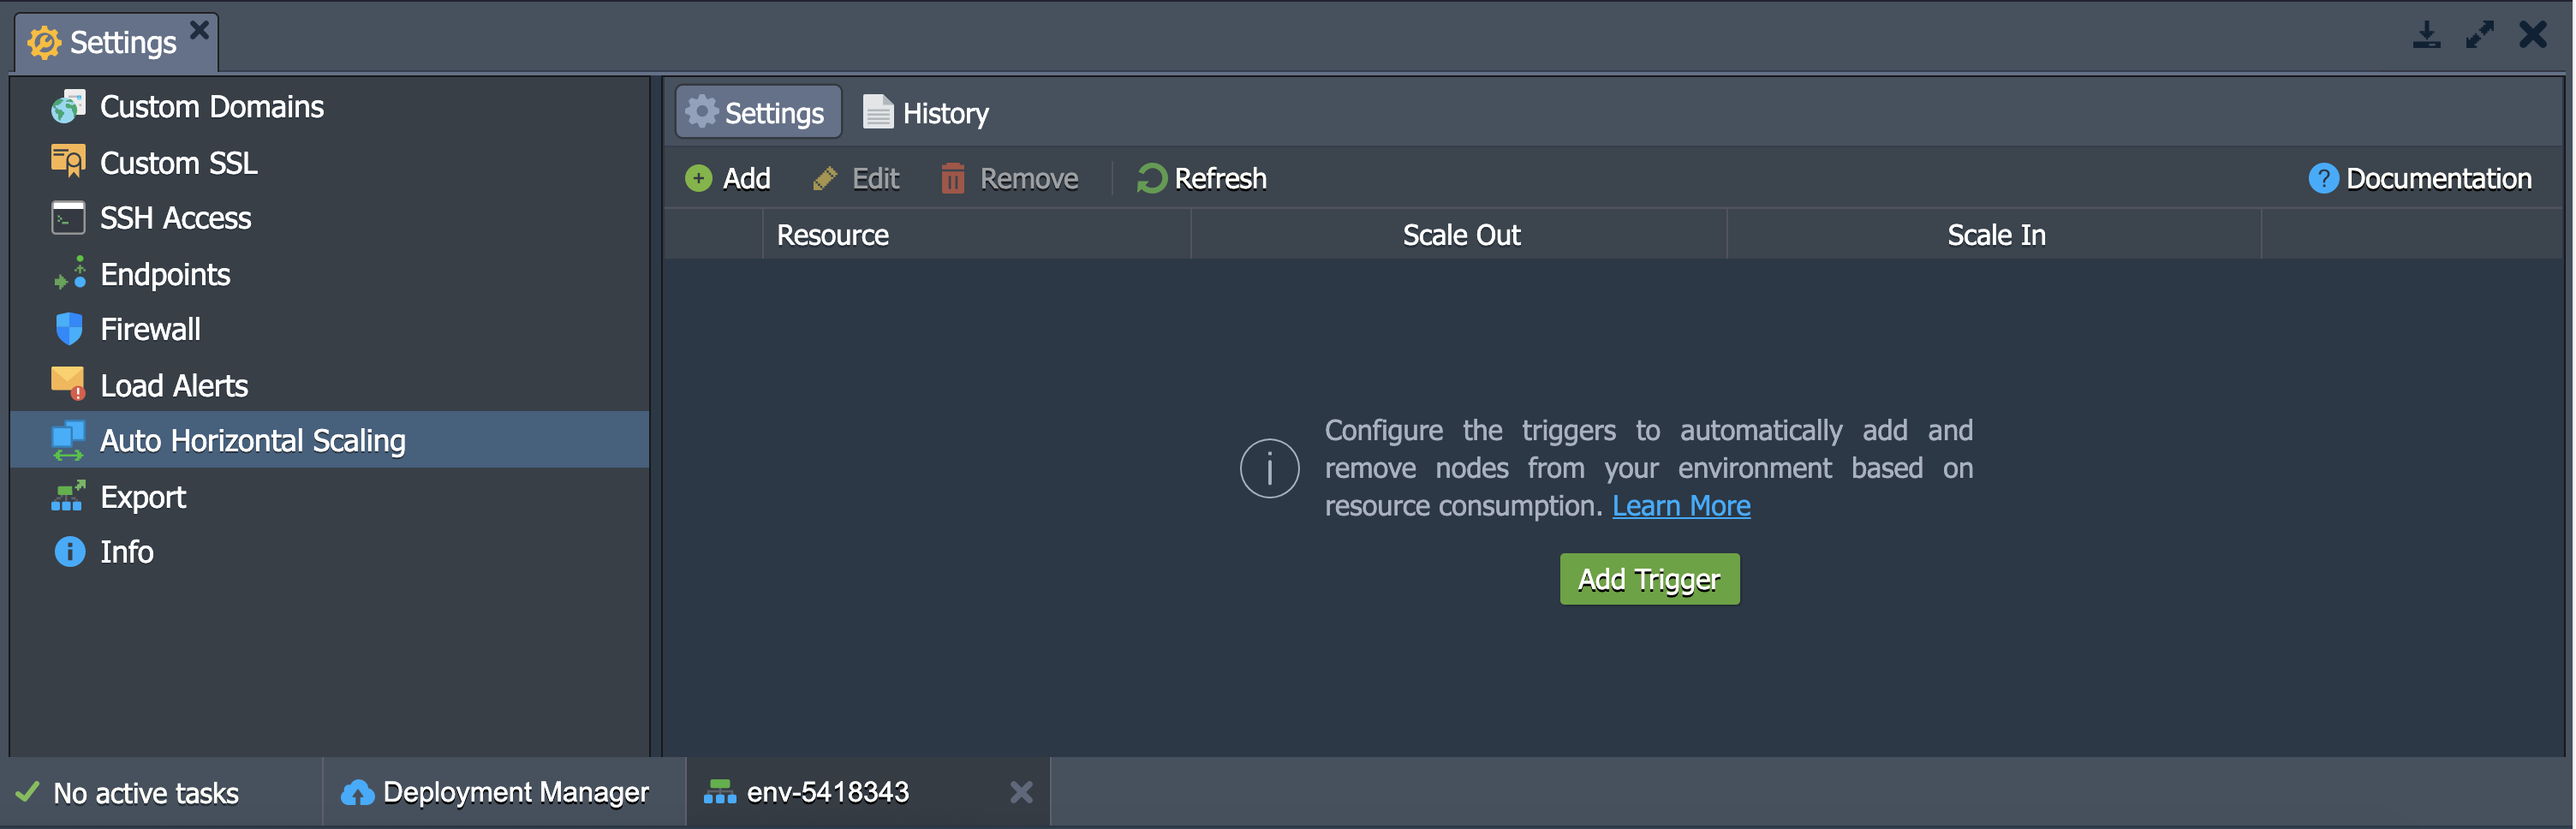
- Auto Horizontal Scaling
Under this subsection, you will find the option to control container numbers in the layers except for the Maven build node. Scaling conditioning depends on several factors including the CPU, Memory, Network, Disk I/O, and Disk IOPS Consumption.
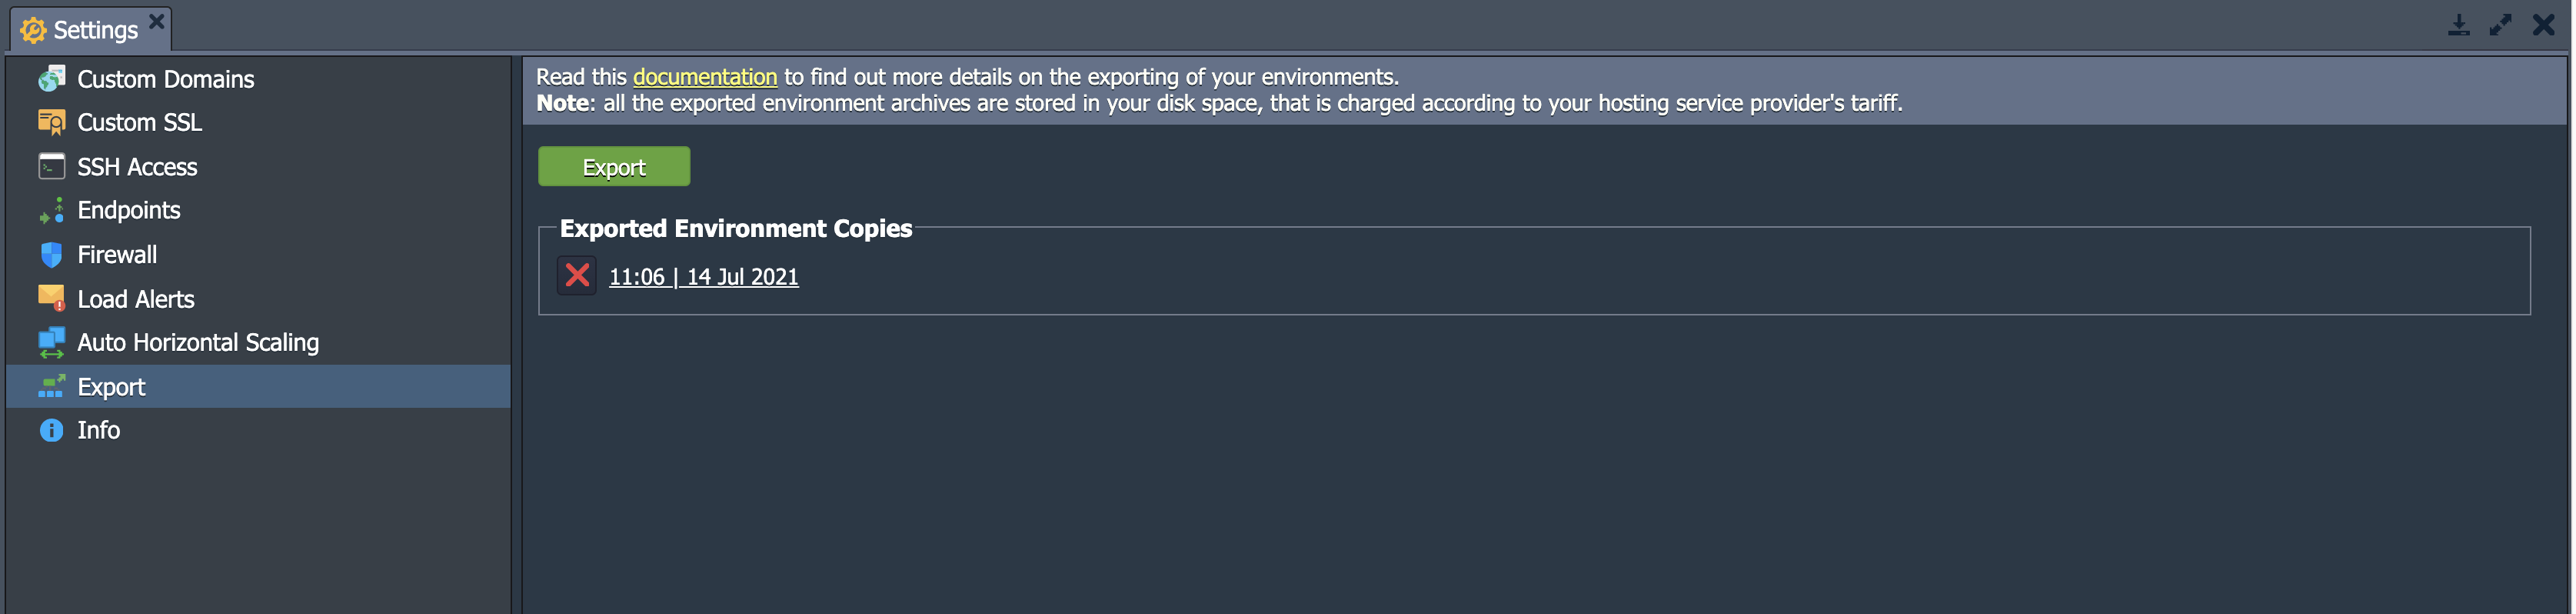
- Export
By clicking on Export in this section, you will create a single file which contains all of your environment data as well as settings. This file can be downloaded and then restored on another platform with another hosting provider. The new copy will be exactly the same:
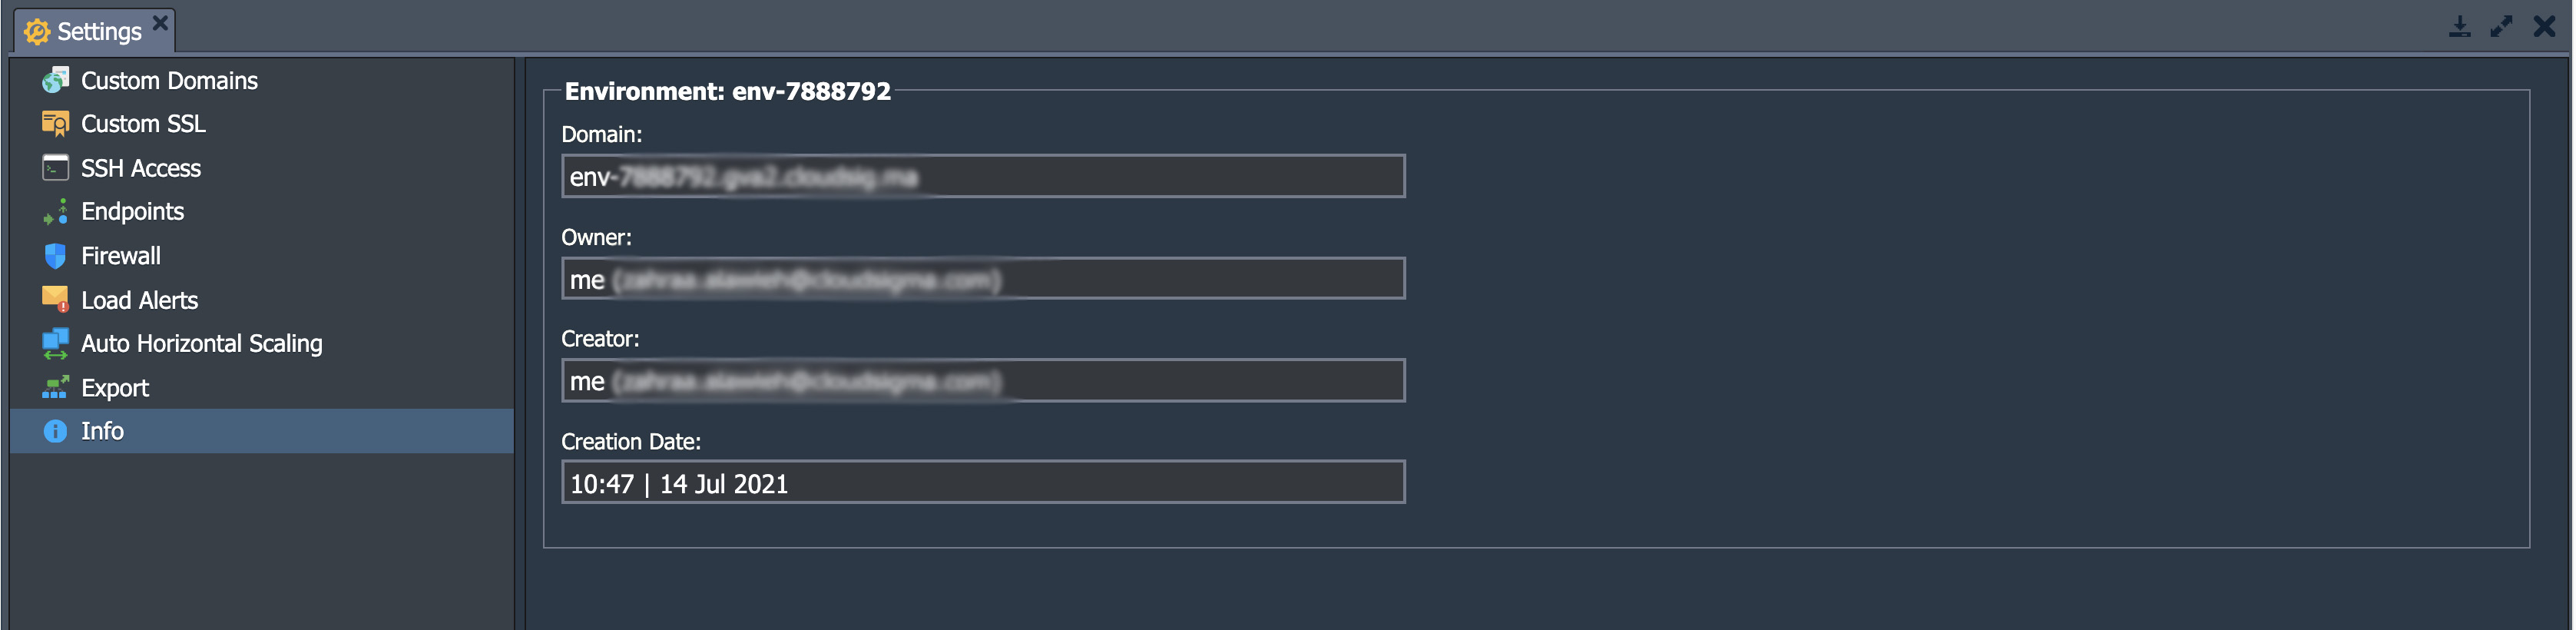
- Info
If you want to learn more about your environment, such as its Domain, Owner, Creator, Region, and Creation Date, head over to the Info section:
Function Icons for Each Instance
If you click on the little arrow icon next to the environment name, you will be able to see a list of all the node groups it comprises. For example, an environment may have load balancers, applications servers, and databases among others. You can further explore these layers by clicking on the arrow and viewing the individual containers and nodes inside of it. Associated with each node is a list of attached IP addresses, both internal and external IPv4/IPv6.
Hovering over the layer or container will show you a set of function icons whose purposes are explained below:
![]()
- Set Alias
As we talked about previously, an alias is an alternative name for the layer/nodes. Aliases help you differentiate between master and slave servers in a cluster.
- Open in Browser
This will open the node of the layer in a new browser tab.
- Restart Node
Use this button to restart the correct service inside a specific container or the whole layer.
- Config
The Config option is used to go to the configuration file manager tab. In this window, you can change your node settings by editing existing configuration or uploading new files.
- Log
This option allows you to look at the log files for the nodes in the given layer.
- Statistics
Statistics keeps track of the data on your CPU, RAM, Network, Disk Space, and IOPS Consumption. You can track this data for individual nodes or a set of nodes.
- Web SSH
Use this option to connect the container over SSH protocol directly in the browser.
- Redeploy Container
This option allows you to update nodes and redeploy them on the right tag or version
- Add-Ons and Remote Desktop
These options are only available for selected nodes. Add-Ons allows you to install pluggable modules while Remote Desktop lets you manage Windows-based nodes.
- Additionally
Using the Additionally list, you can configure your container settings and view SFTP/Direct SSH Access details. Additional options include Reset Password or Admin Panel Login depending on which node you are on.
How to Import
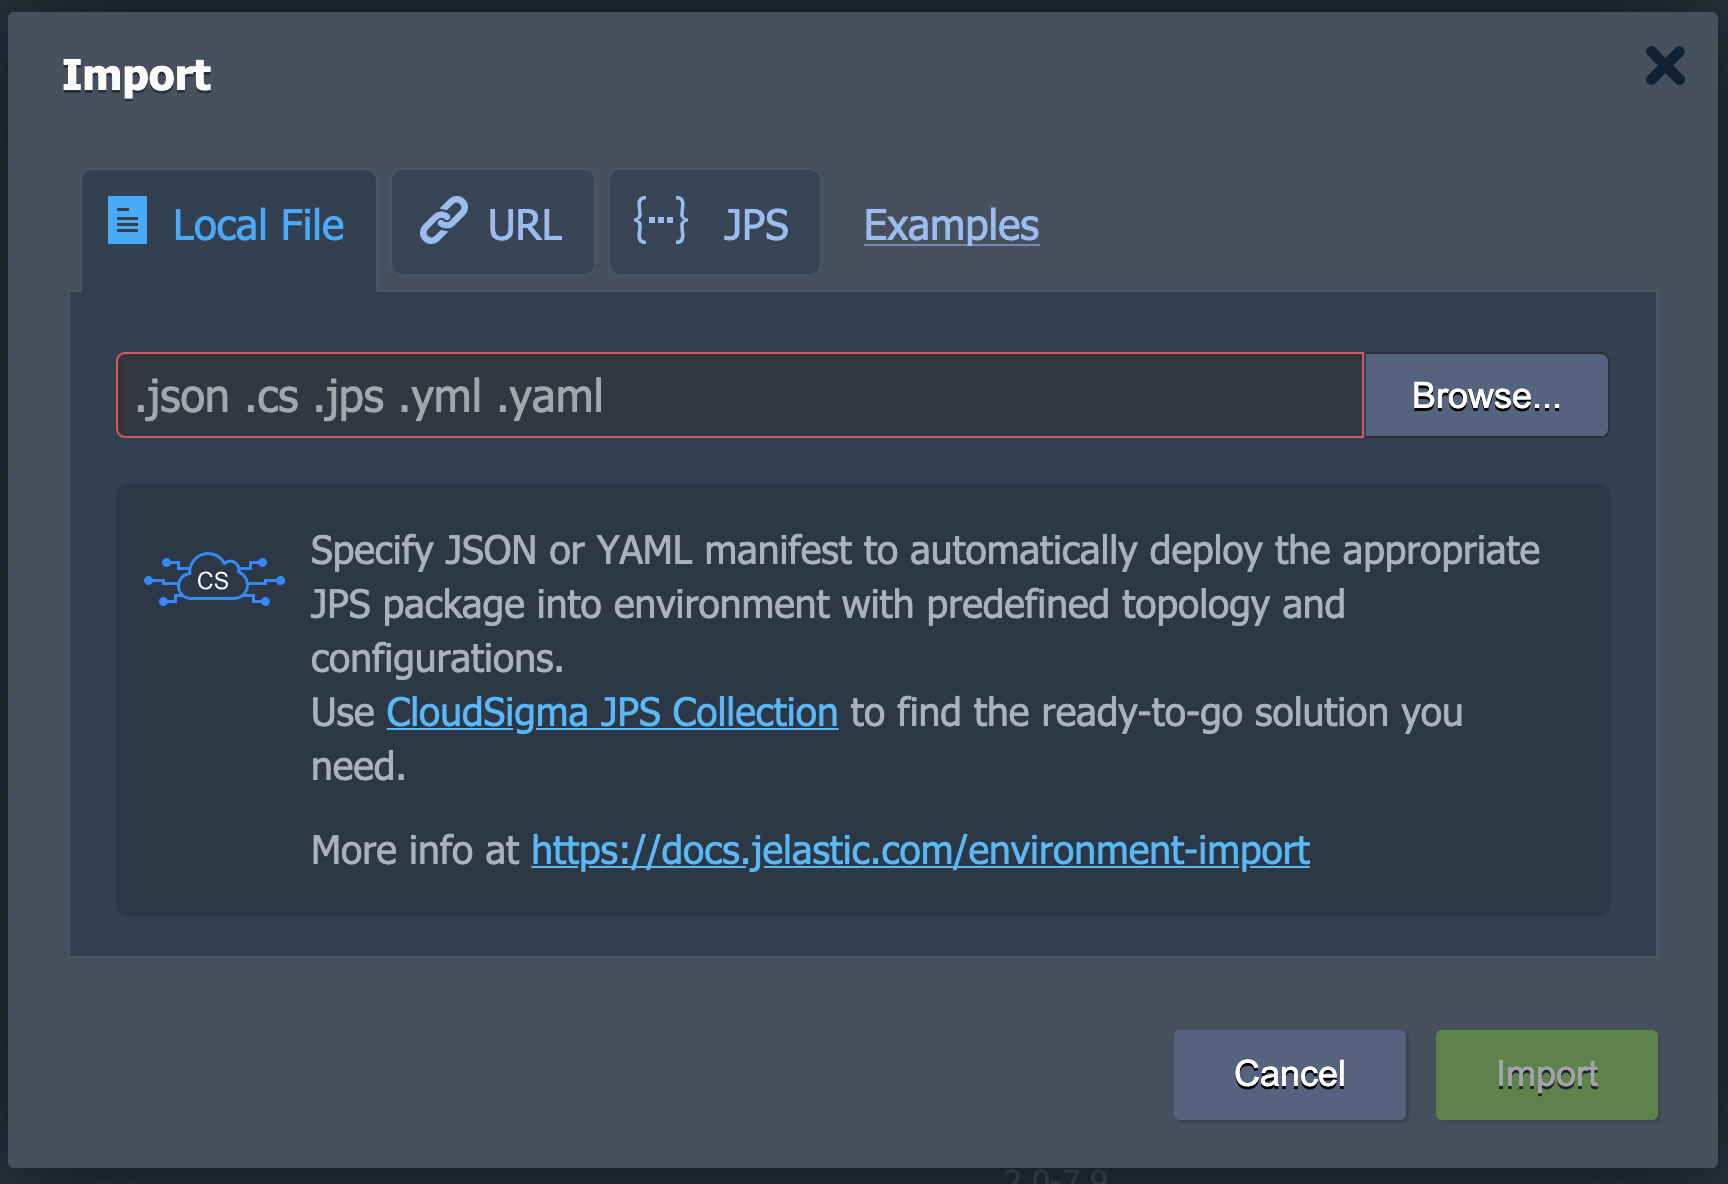
The Import option is located right next to the button for creating a New Environment. You can upload .json, .jps, .cs, .yml, and .yaml files using this button. You can either create a new environment or use them to modify an already existing one:
When you open the Import window, you will see three tabs along with a link to Examples. This link will show you a PaaS Collection with several pre-packaged solutions:
- Local File
This tab allows you to select a local file from your system using the Browse button and execute it on the PaaS.
- URL
Using this, you can enter a direct link for the file.
- JPS
Lastly, you can use the built-in JSON/YAML editor to insert or write custom code and deploy it:
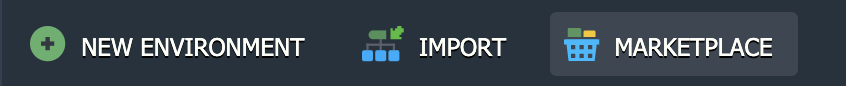
Marketplace
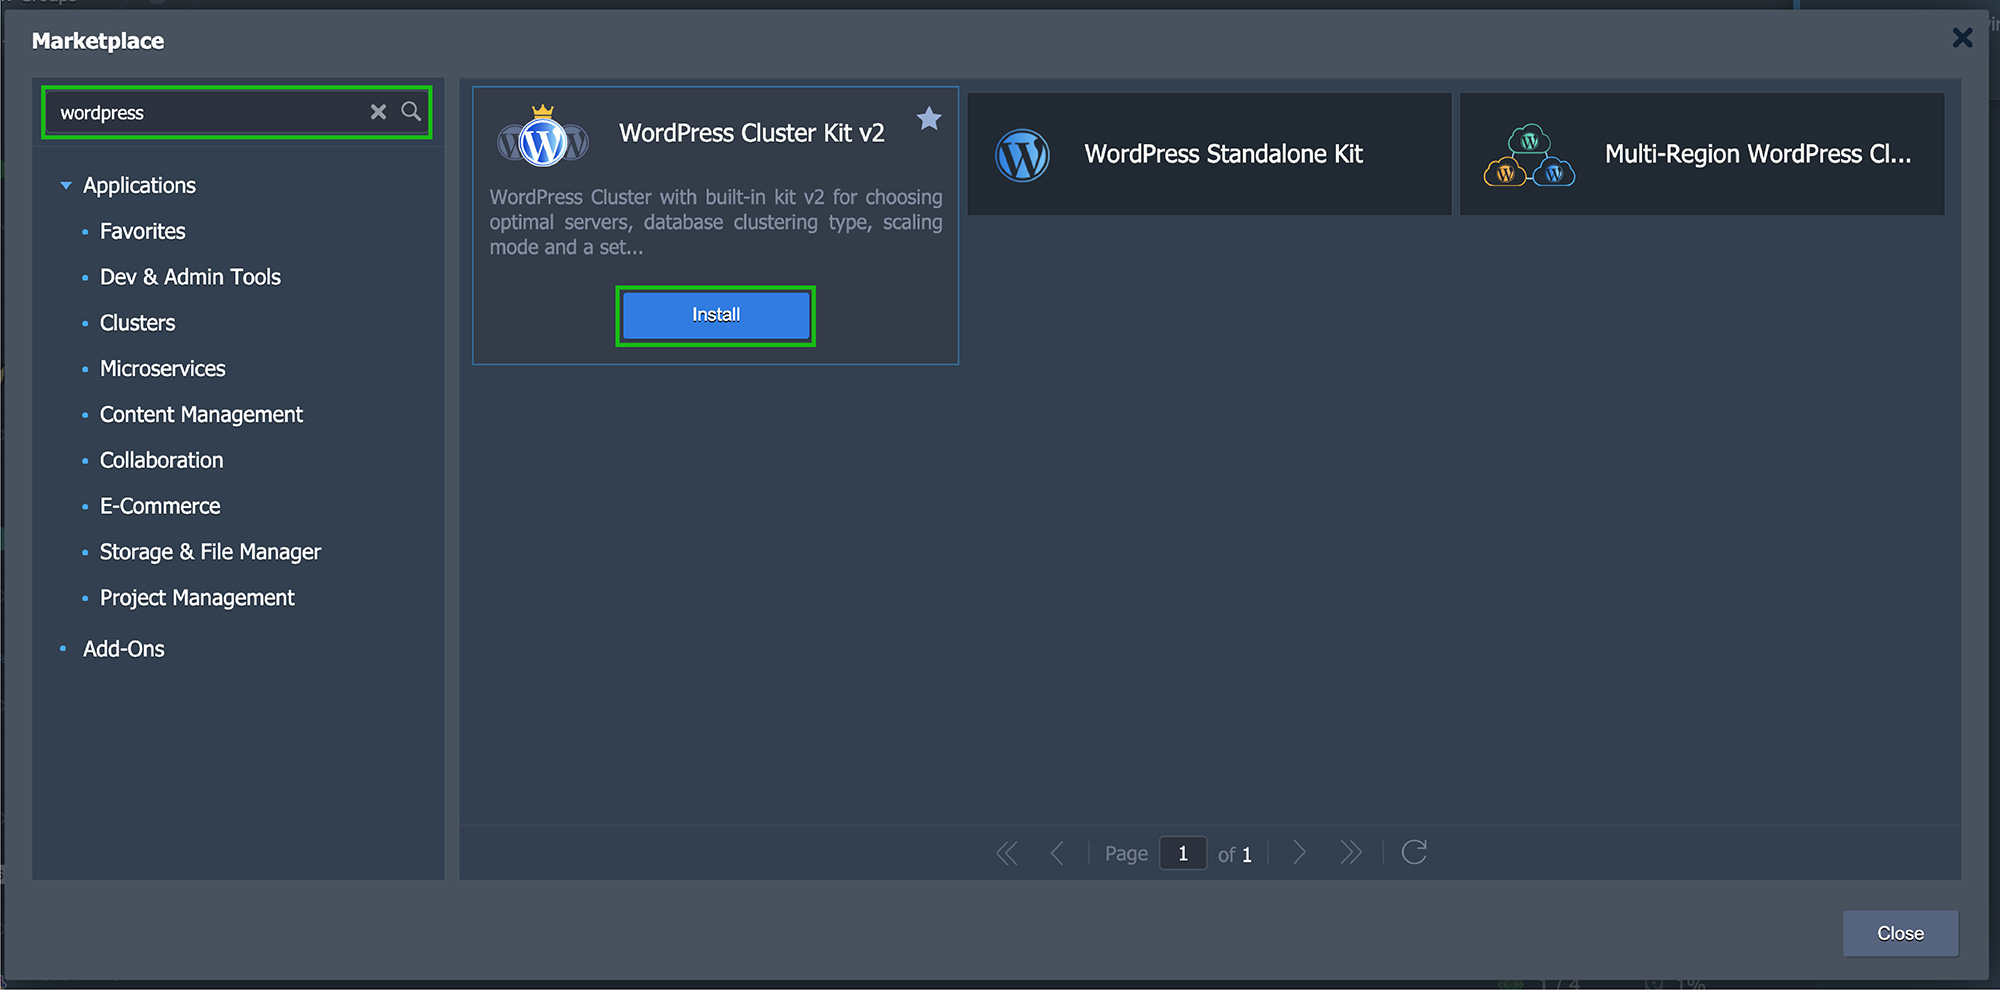
The Marketplace button is located near the top of the dashboard. Clicking on it will take you to a brand new frame. This window will contain pre-packaged solutions which you can simply install on your dashboard as needed.
For your convenience, these packages are divided into Applications and Add-Ons. Applications assist in the creation of new environments while Add-Ons help with existing ones. You can use the search bar in the top left corner to find what you are looking for in either category.
Once you find the desired package, click on Install. Follow the instructions as outlined by the window to complete installation and start using it:
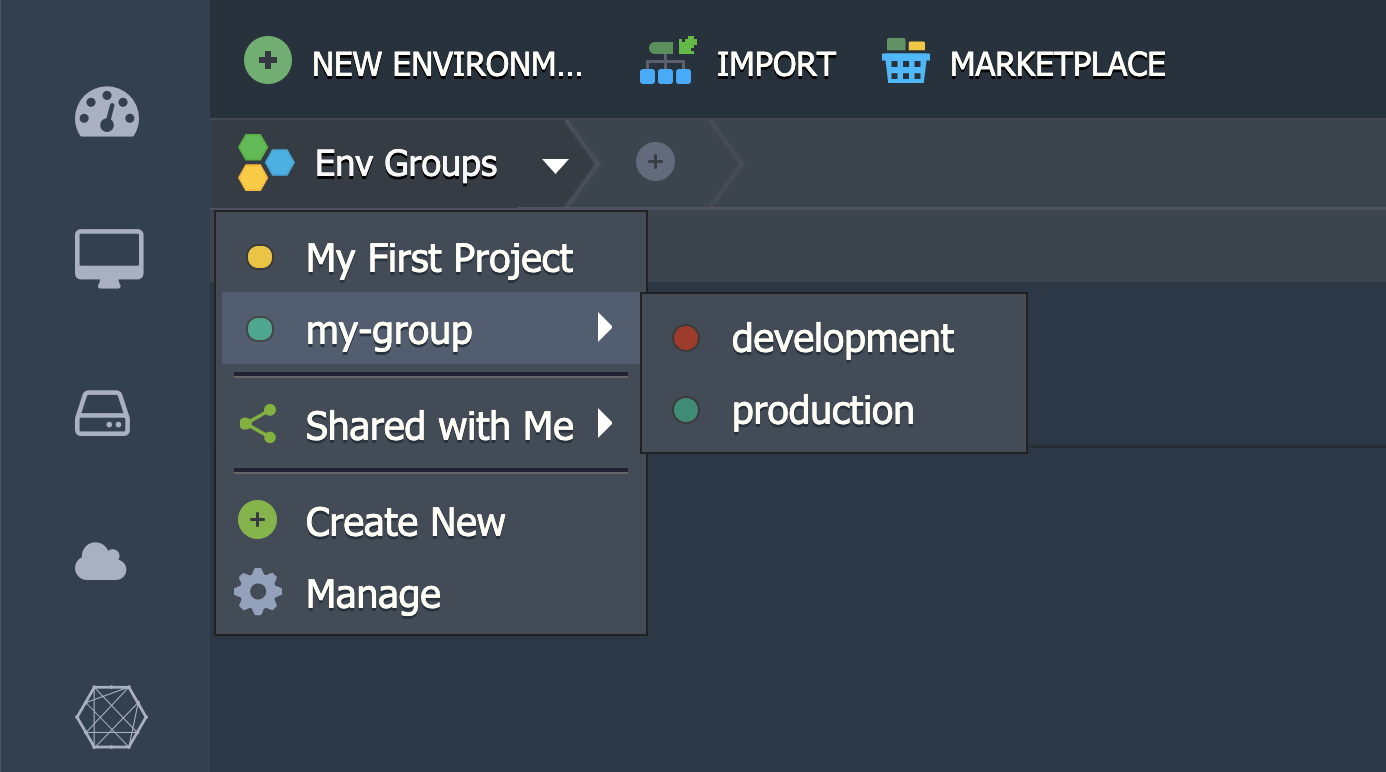
Creating Environment Groups
With the CloudSigma PaaS, you can also create Environment Groups. This facilitates better categorization and organization of your environments on the interface.
Let’s say you are operating multiple projects under a single environment. You can group them together in a dedicated environment group. You can also make subdivisions by creating subgroups based on their function or purpose. For example, you can make dedicated subgroups for development, testing, and production or servers, databases, and storages:
Running a Dashboard Search
If you are struggling to find something on the CloudSigma PaaS dashboard, you can utilize the built-in Search feature. You can either open the Search form by clicking in the top right corner or by using the shortcut Ctrl+F/Cmd+F.
For example, you can enter the IP/ID of a container to locate it on the platform. You can search for deployed projects and environments as well:
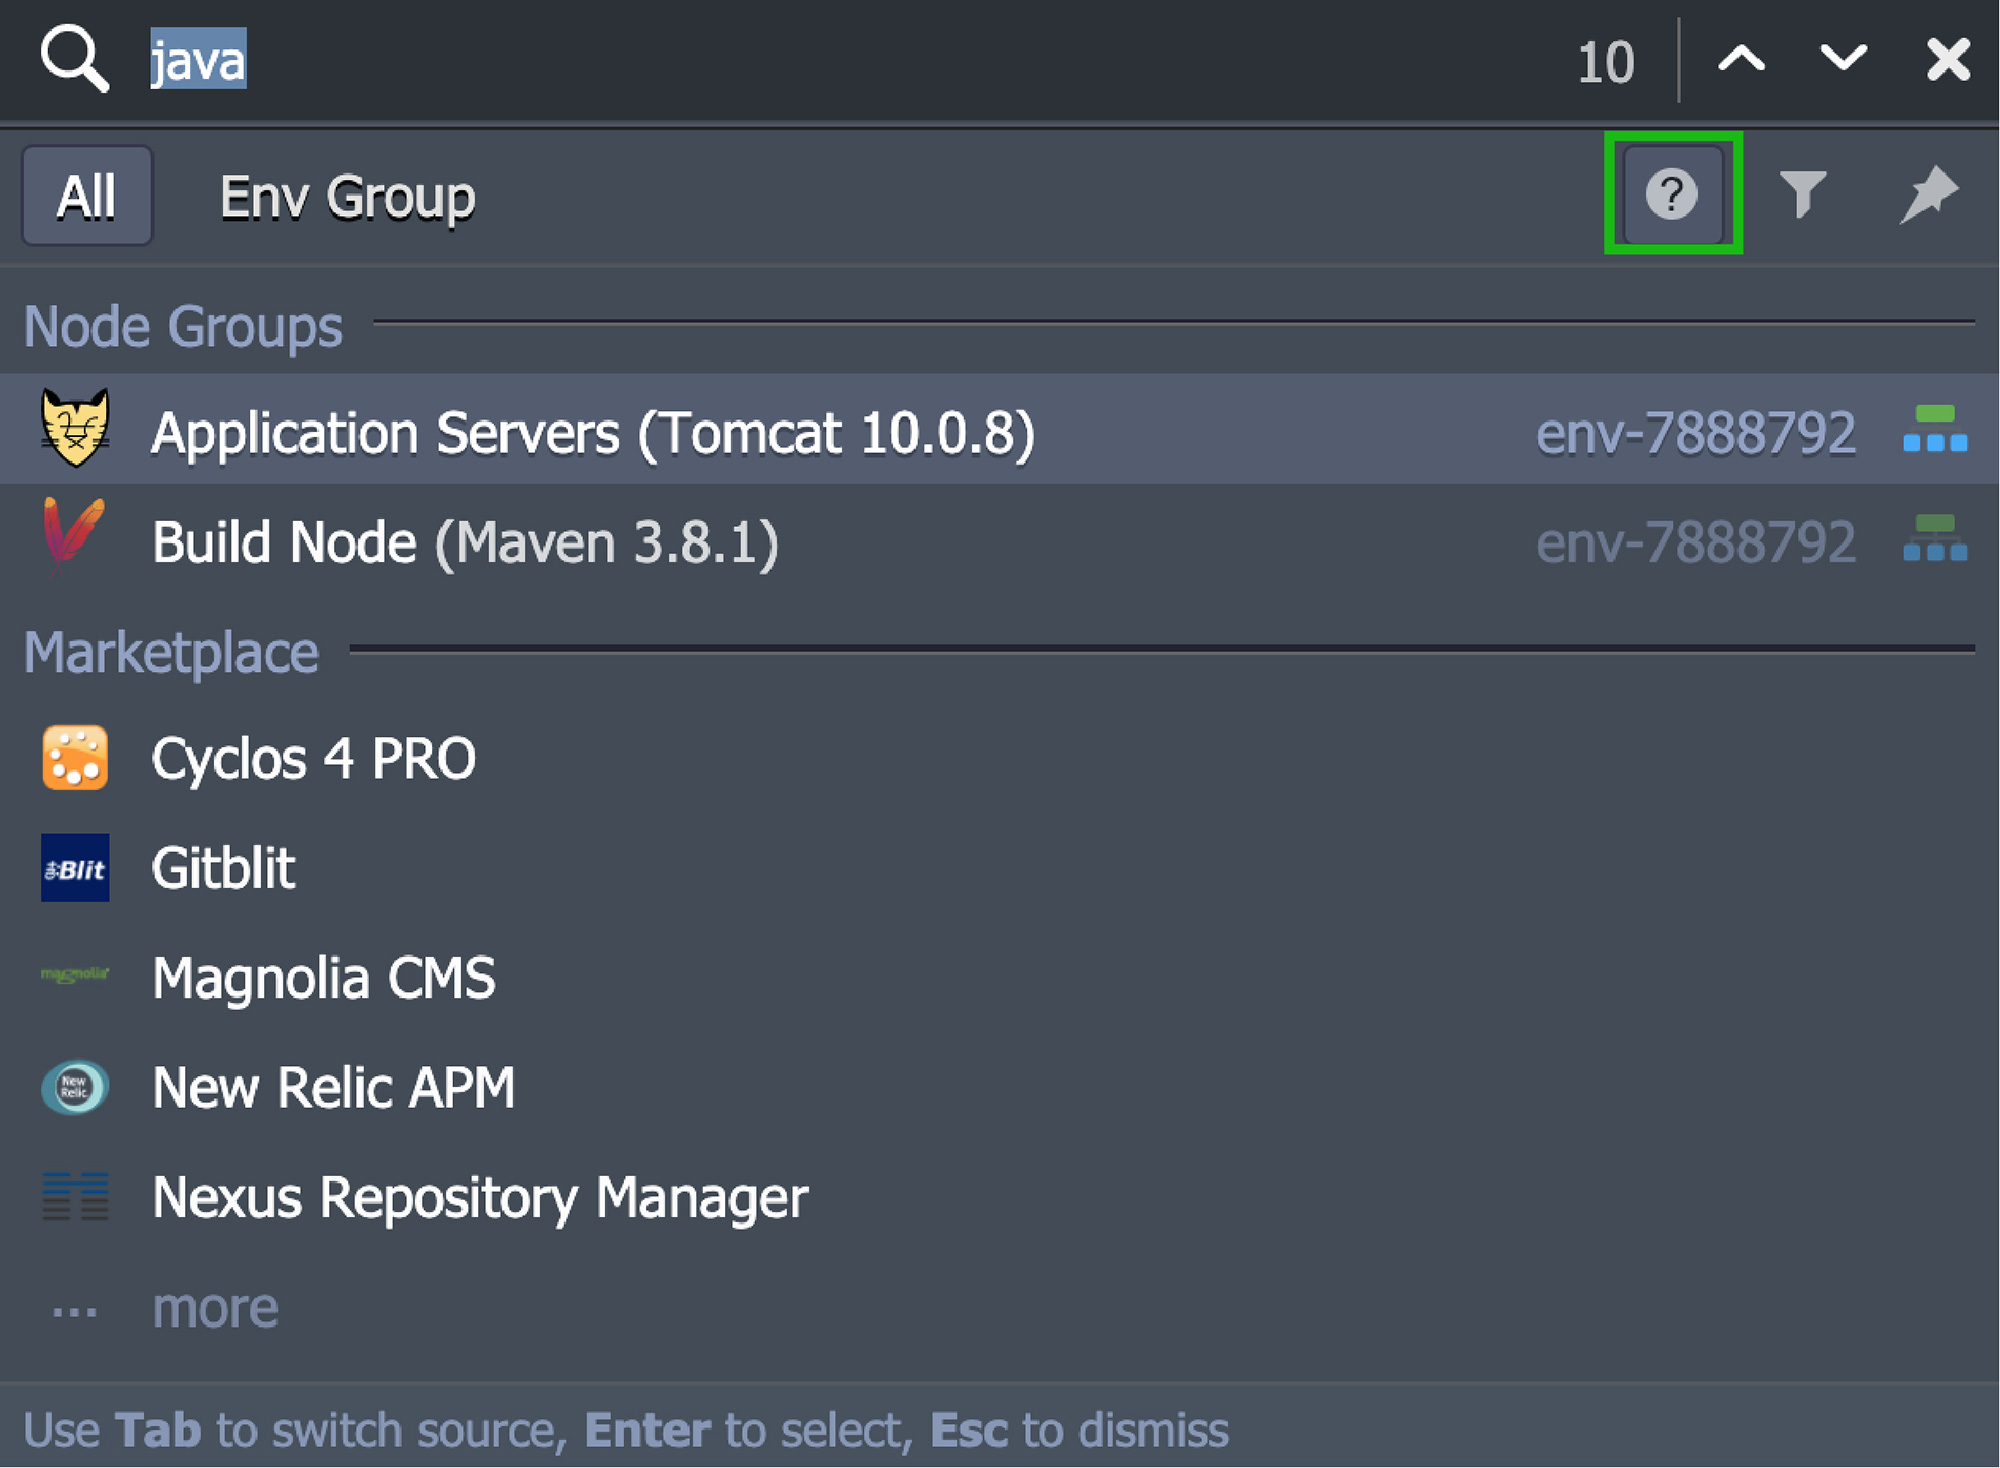
What makes the CloudSigma PaaS Search feature so unique is its customizability. Among other things, you can add special characters for search expression (such as using ‘-’ to exclude terms or ‘*’ wildcard). You can search sources like your account or a particular environment group. You can also apply a categories filter to include and exclude different types of data and packages.
If you still cannot find what you are looking for, refer to the help hint.
Deployment Manager
You will find this option at the bottom of the dashboard. This Manager contains all the applications you need to automate their deployment into the environments. The tab is further divided into two subsections:
- Archive
The Archive contains the application package. You can Upload it using either a Local File or an external link/URL.
- Git / SVN
This subsection saves the access credentials at the remote Git/SVN repositories. You can enter the necessary details by clicking Add Repo.
Tasks Panel
Another feature that you will find near the bottom of the dashboard is the Tasks Panel. On opening this panel, you will see all the data about the work that is currently being done or has happened in the past on CloudSigma PaaS:
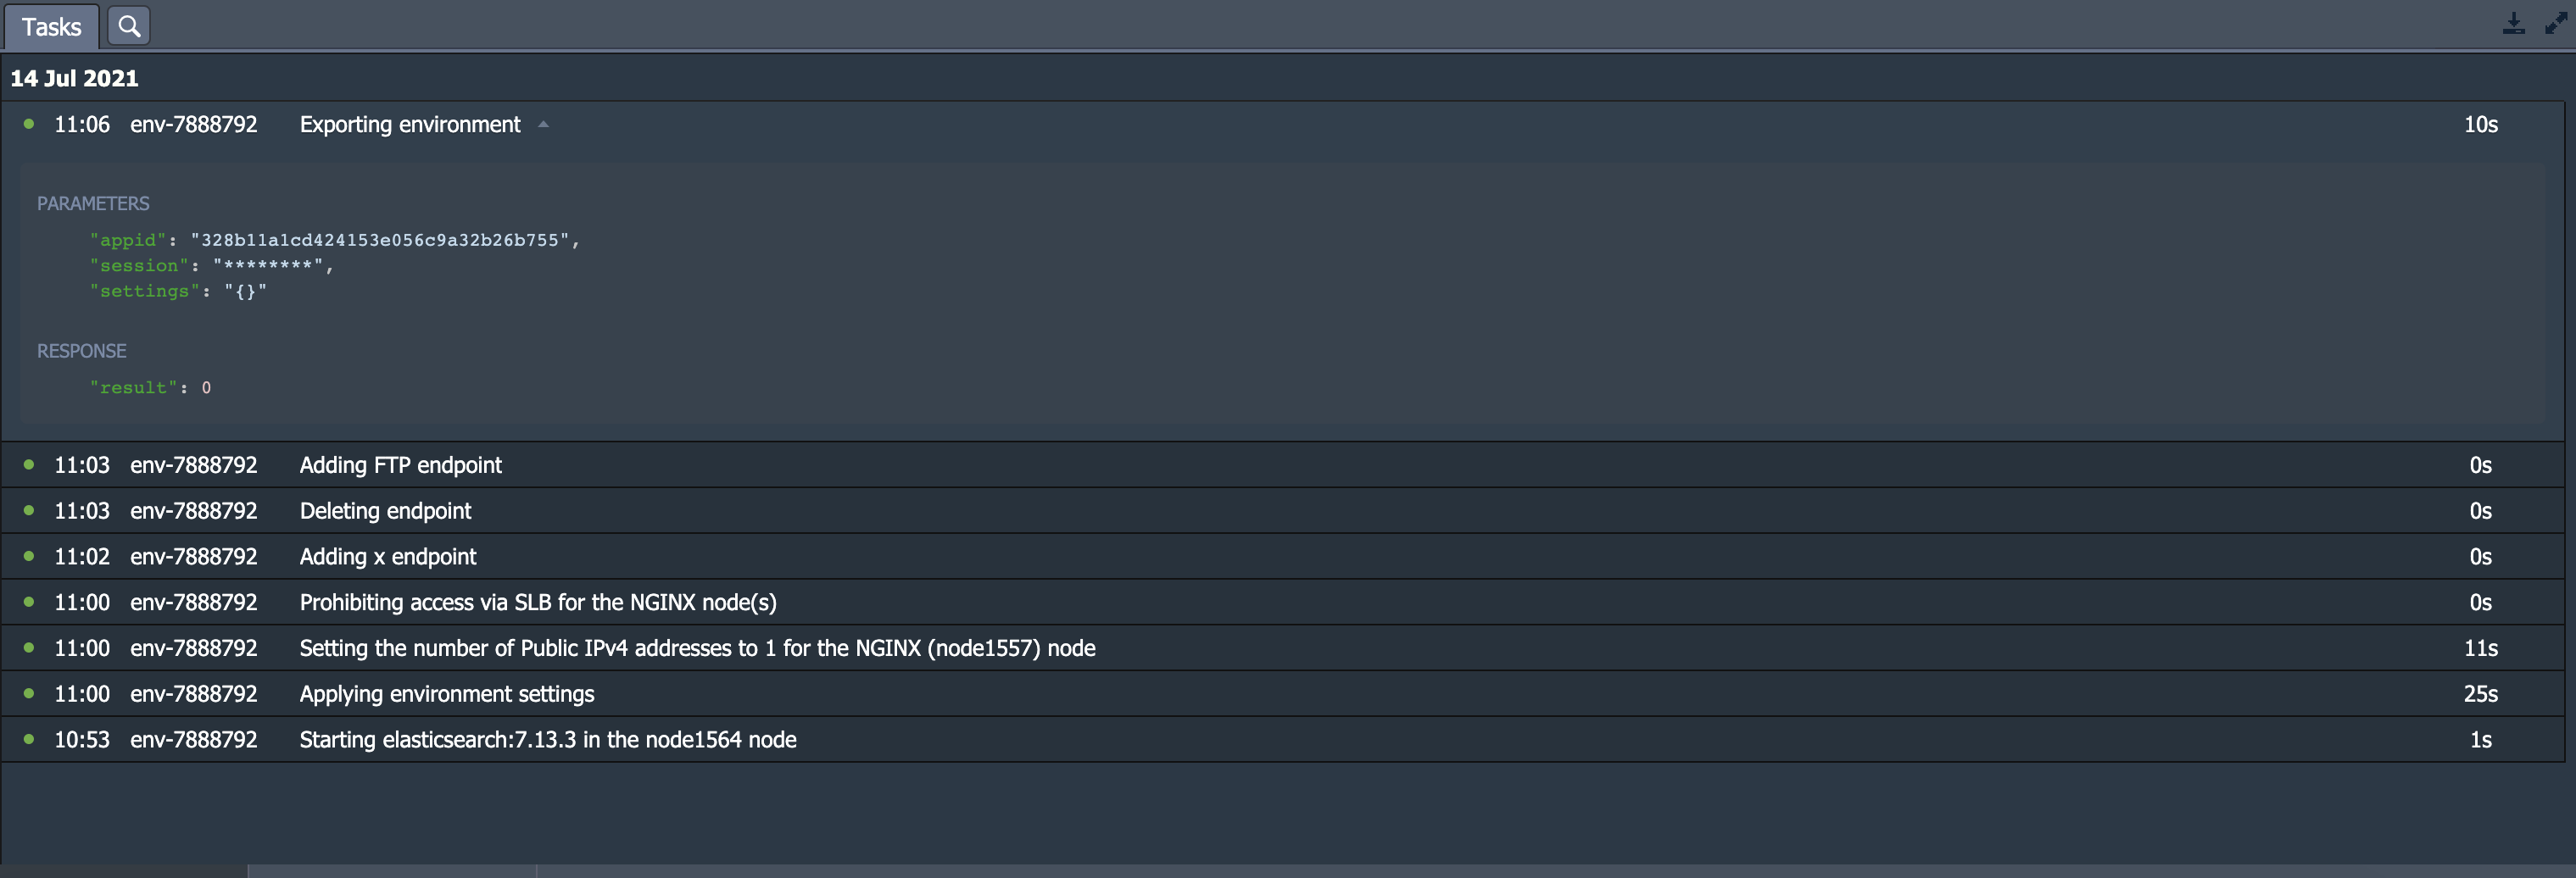
For each piece of data, you will see the following details:
- Status
The status shows whether the operation is currently in progress (spinner icon), successfully executed (green dot), or failed due to an error (red dot).
- Time
It shows when the operation started. The latest records will show up at the top of the dashboard. The tasks are grouped based on the day they were performed.
- Environment
It shows the name of the environment inside which the action was performed. If there was no particular target environment, you will see a ‘-’.
- Task
It provides a brief operation description of the task along with the error if it failed to execute.
- Duration
It shows the time it took the system to execute a given task.
The Tasks Panel has another tab labeled as the Activity Log and is denoted by a magnifying glass. Clicking on this will take you to a window displaying the full list of all actions performed on the current account:
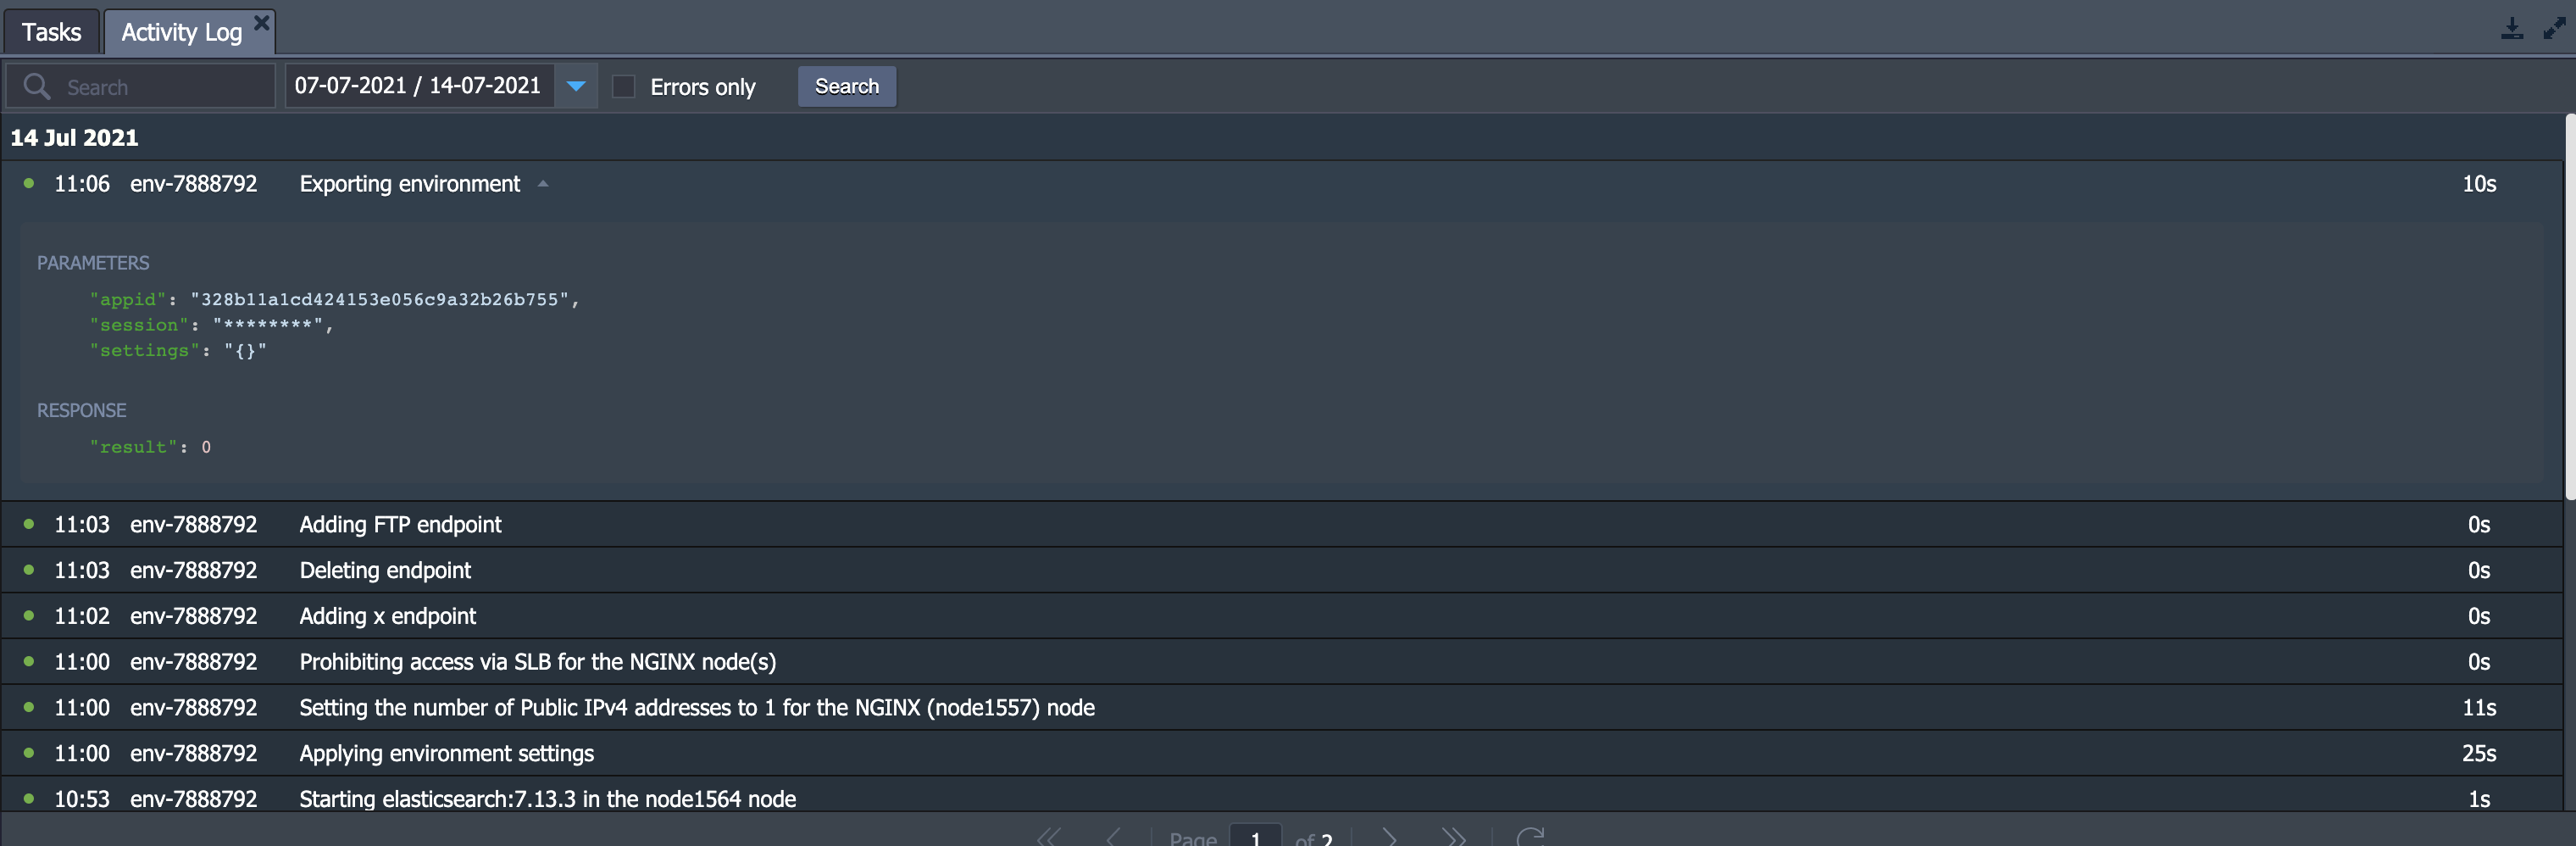
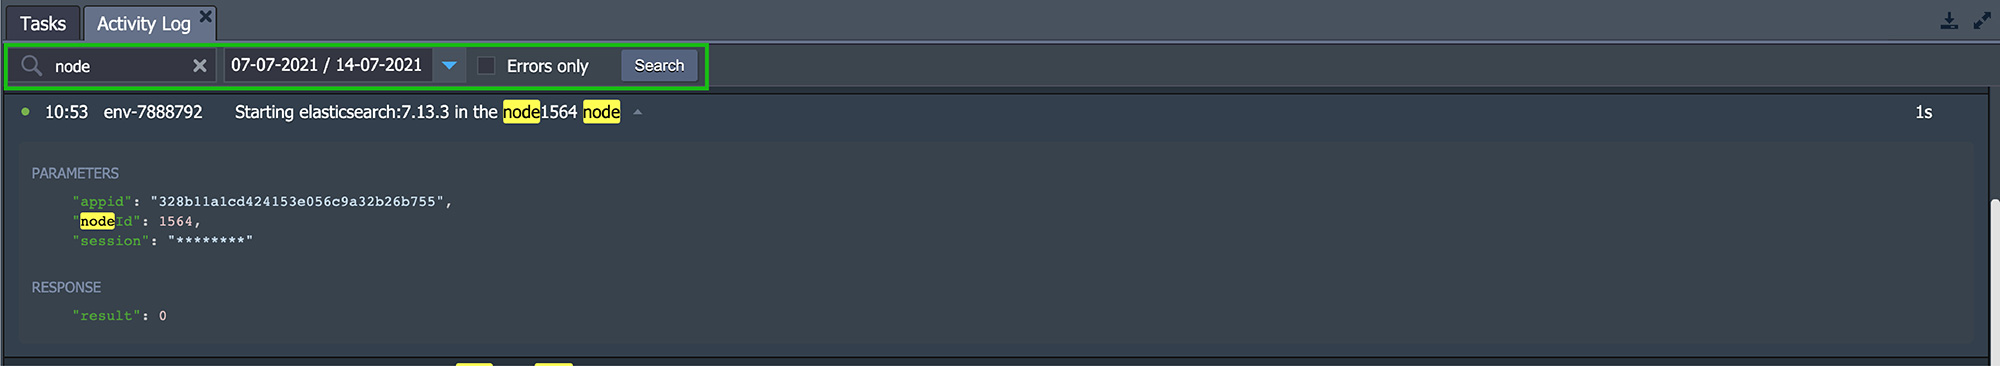
This tab has more advanced search options. For example, you can search for actions based on parameters and server response as opposed to the action description. You have the option to set a date range as the last 1, 6, or 24 hours/ current or previous week/current month/custom period. If you want to hide the operations that have been successfully executed, tick on the Errors only option:
This tab is quite useful for activity tracking and troubleshooting for errors.
Changing User Settings
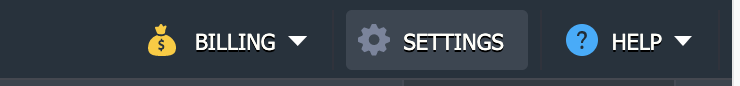
User Settings allow you to configure things regarding your personal account and other elements around the dashboard. To explore, click on the Settings button on the top right corner of the platform:
Settings are divided into three sections. These include Account, Access Tokens, and SSH Keys.
Let’s start with the Access Tokens section:
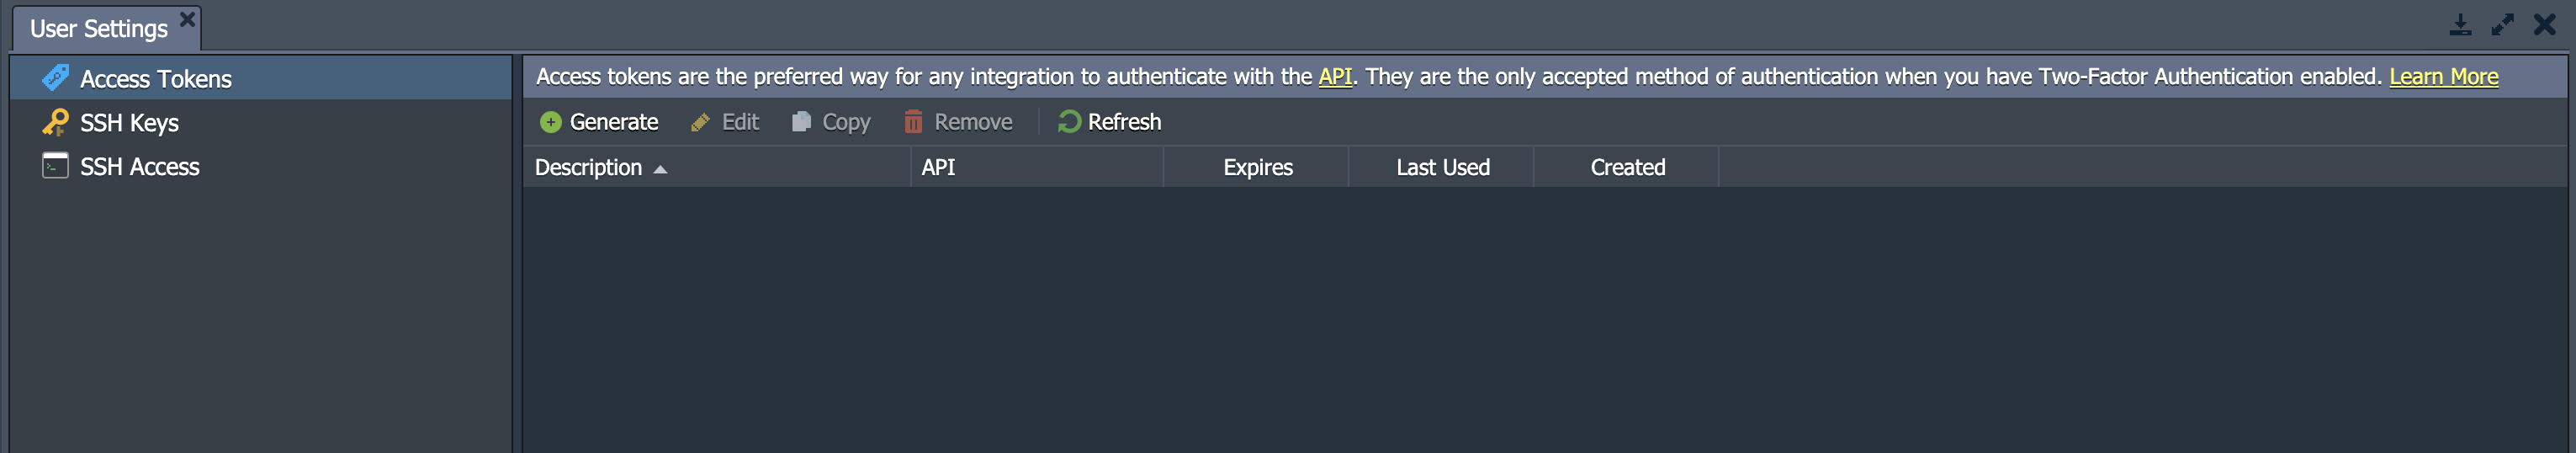
- Here, you can configure the personal access tokens for your account.
The next section is for SSH Keys or SSH Access points. Both these options open the same section with the following tabs:
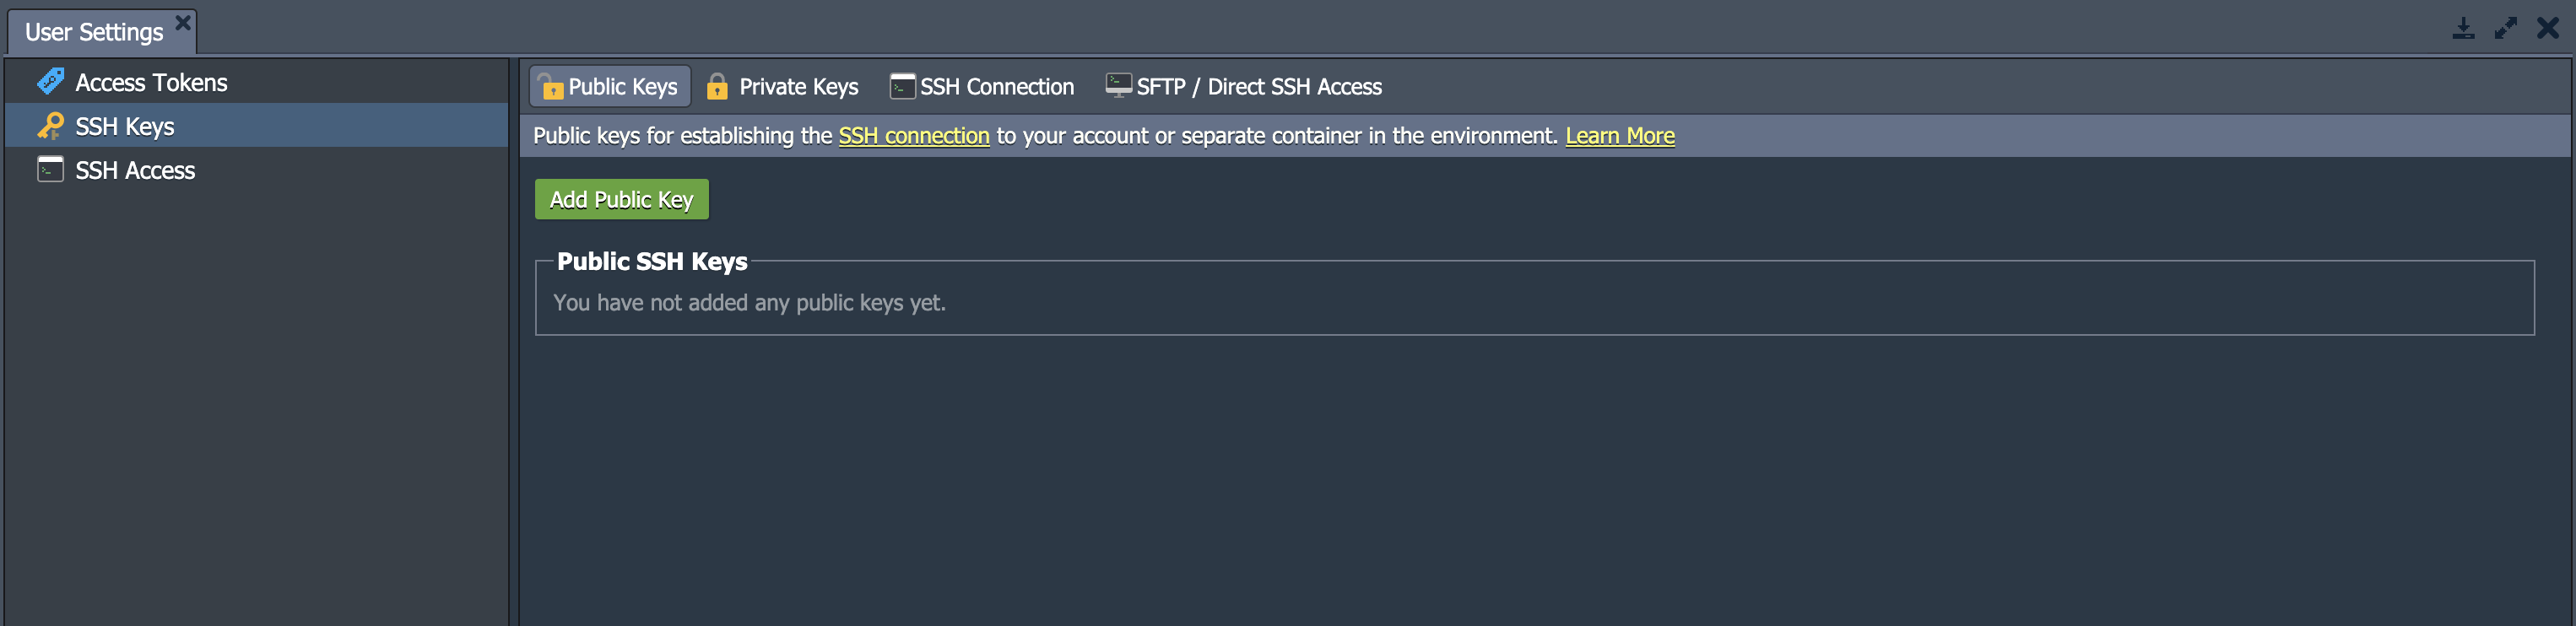
-
- Public Keys stores and displays the public keys you are using for remote access on your platform.
- Private Keys stores and displays the private keys you have added to your platform. You can use these to access your private Git repository over SSH.
- SSH Connection displays the steps you need to follow in order to connect your account through the SSH Gate. This allows you to access nodes directly in the browser via Web SSH.
- SFTP/Direct SSH Access shows the relevant connection data for the SFTP/FISH protocols.
Upgrading Your Account
Depending on the type of account you have, you may see either Upgrade Account or Balance at the top of the dashboard. All users start off with a trial version which can be upgraded to a full access one. While the trial version is free of cost for 7 days, you can uplift the trial restrictions on resources by upgrading it.
To view your options regarding upgrading your account, click on the arrow so that it opens the drop-down menu:
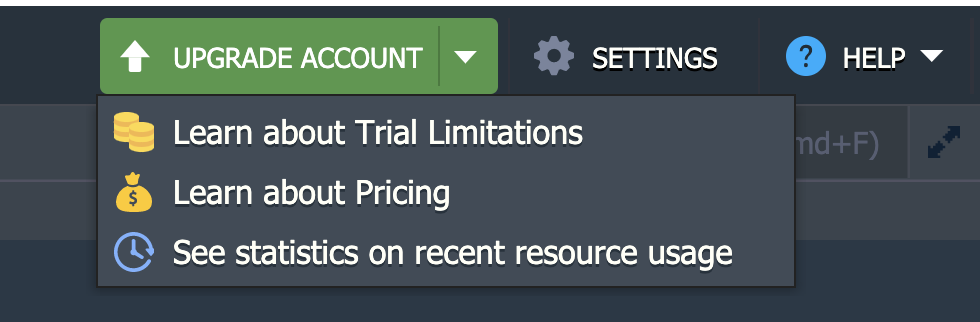
- Upgrade Account
To sign up for an upgraded account with no limitations, click on this option.
Adding Balance
You can further explore your options by clicking on the Balance button. It will show the following drop-down list:
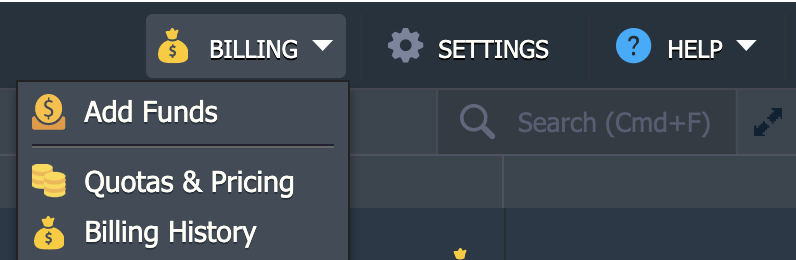
- Аdd Funds
This section forwards you to the Add Funds section in the CloudSigma WebApp where you can initiate a payment using one of our supported payment methods depending on your preference.
- Quotas & Pricing
Quotas & Pricing opens up an information frame dialog box. Navigate through the tabs about platform Regions, Pricing, and Account Limits to learn more.
- Billing History
Here, you can keep track of all of your account spendings for a given time period.
Getting Help
The Help section opens up a drop-down menu with the following items:
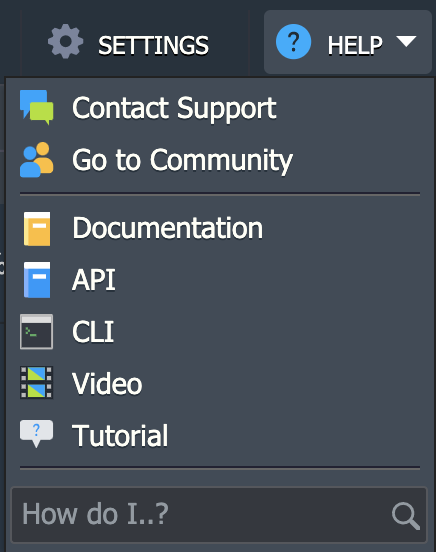
- Contact Support
If you are having trouble with something and cannot find the solution, then click on Contact Support. You will be taken to the customer support page on the platform which is fully accessible to billing users.
- Go to Community
This link will take you over to the exciting online community at the PaaS Stackoverflow.
- Documentation
This option opens up the Devs Documentation.
- API
You will be redirected to the API Documentation offered by CloudSigma PaaS.
- CLI
You will be redirected to the CloudSigma PaaS Command-Line Interface Overview.
- Video
You will be redirected to the CloudSigma YouTube channel for further guidance.
- Tutorial
This option can be used to launch an interactive guide. It is a short tutorial designed to familiarize you with the platform and its fundamentals.
- How do I..?
This option opens up a list of documents. These documents are relevant to the request you type in.
You аre now aware of the fundamental infrastructure of the CloudSigma PaaS dashboard. You can continue creating and modifying your very own project on the platform and refer back to this guide if you need help.
Do not hesitate to contact CloudSigma’s helpful support team by email at support@cloudsigma.com if you have any questions or doubts. They are available 24/7 completely free of charge by email and chat and are happy to help you with your inquiries.
As you can see, CloudSigma’s PaaS Dashboard is straightforward and user-friendly. You can learn more about our PaaS service right here. Give CloudSigma’s PaaS a try with our 7-day free trial or contact us if you want us to provide you with more details and a platform demo.
- 5 Tips to Achieve Optimal Cloud Computing Cost Efficiency - October 31, 2022
- CloudSigma Empowers Blockchain Infrastructure Provider with a Green, Reliable, and Cost-Efficient Cloud Platform - October 27, 2022
- Whitech Launches New Egypt Cloud Computing Offering, Powered by HPE and CloudSigma - October 17, 2022
- Key Aspects of Protecting your Data in the Cloud - September 20, 2022
- How to Configure MongoDB Replication and Automated Failover - September 19, 2022